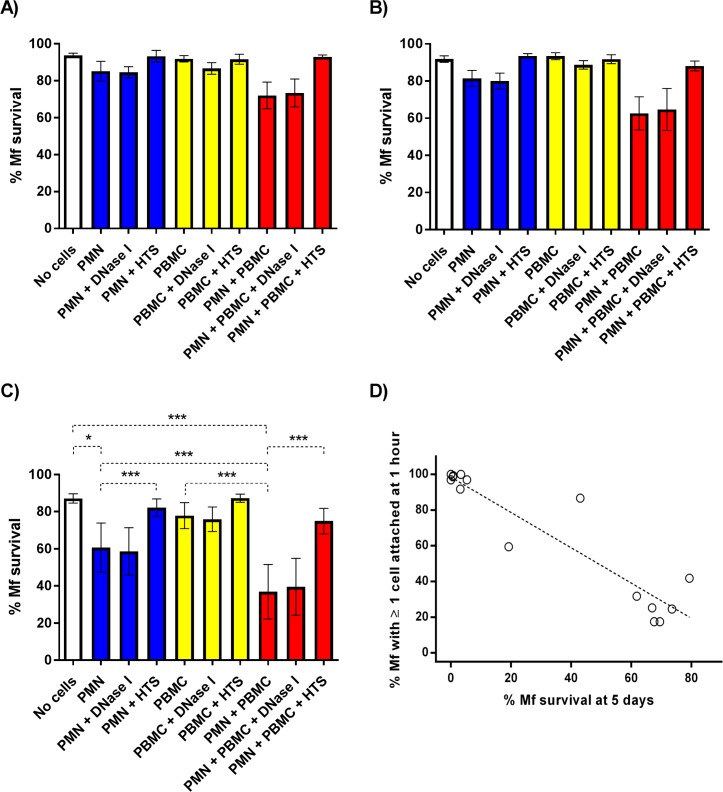
Fig 4. Mf survival in the presence of PMNs and PBMCs.
The percentage of Mf that survived to days 1 (A), 2 (B) and 5 (C) post-experimental set up (n = 5). White, blue, yellow, and red bars represent zero cell, 1500 PMN/Mf, 1500 PBMC/Mf and PMN plus PBMC treated wells respectively. All wells contained either 25% autologous serum or 25% heat treated serum (HTS). DNase I denotes the addition of 30μg/ml DNase I. Error bars represent standard error of the mean; *P<0.05, **P<0.01, ***P<0.001. D. Scatter plot comparing leukocyte attachment and Mf survival in the presence of PMNs and PBMCs. The percentage of Mf that had at least one PMN/PBMC adhered to their surface or indirectly fastened by extracellular DNA at 1 hour post-experimental set up plotted against the percentage of Mf that survived to day 5 (n = 15). Each point represents an individual biological replicate derived from distinct human blood donors. All wells contained 25% autologous serum, ~100 Mf, ~150,000 PMNs and ~150,000 PBMCs.

