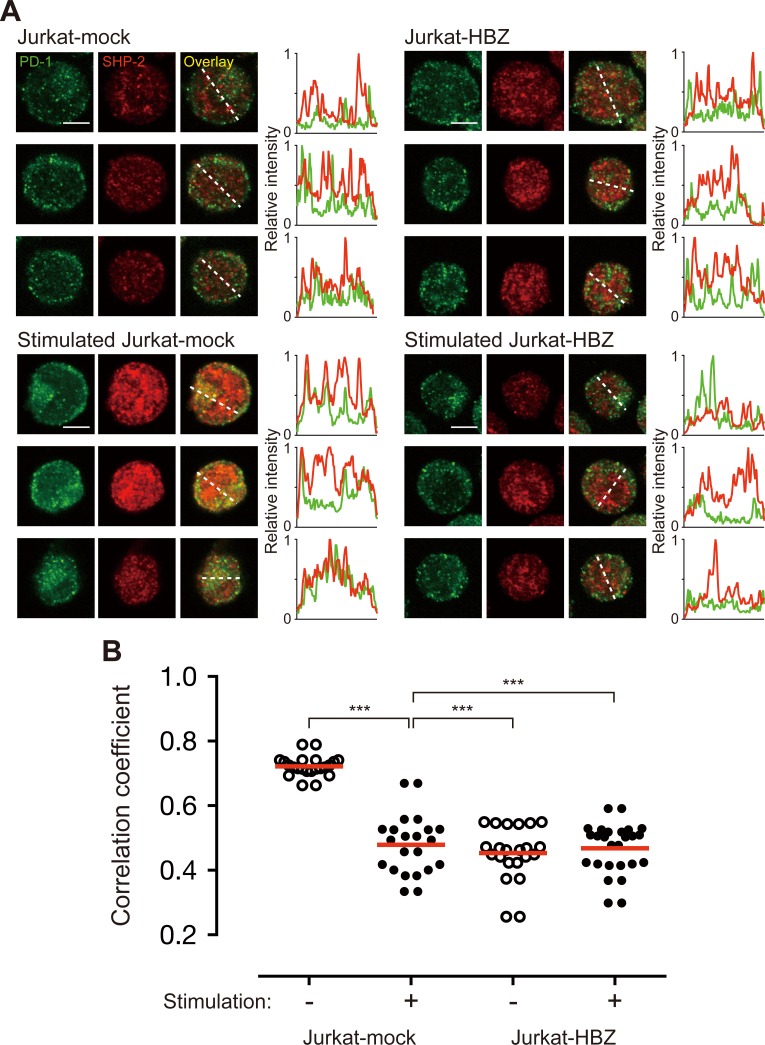
Fig 5. HBZ inhibits co-localization of PD-1 and SHP-2.
(A) Staining of unstimulated or pervanadate-stimulated Jurkat-mock and Jurkat-HBZ cells was performed using antibodies against PD-1 (green) and SHP-2 (red). All scale bars are 5 μm. Three representative images derived from each sample are shown. Relative fluorescence intensities of PD-1 (green line) and SHP-2 (red line) were obtained on the white dotted line. (B) Co-localization of PD-1 and SHP-2 was judged by Pearson’s correlation coefficient between green and red channels. Each circle represents an individual cell. Statistical analysis was performed using one-way ANOVA with Tukey’s post hoc test.

