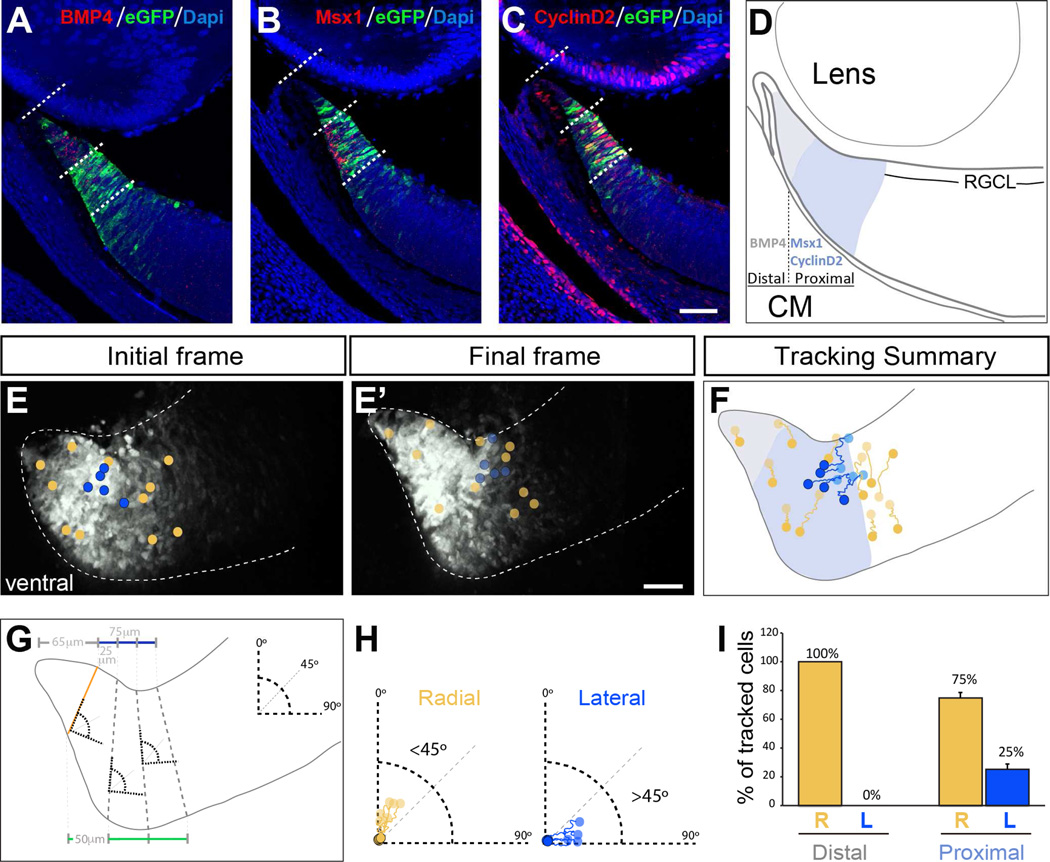
Figure 2. A population of cells in the proximal CMZ at E14.5 moves laterally towards the neural retina.
A–C. Expression of BMP4, Msx1 and Cyclin D2 in ventral retinal sections at E14.5. BMP4 is expressed in the most distal part of the CMZ while Msx1 and Cyclin D2 label a more proximal region of the CMZ. In turn, Msx1 and Cyclin D2 show complementary patterns of expression along the apico-basal axis: Msx1 is enriched in the most apical (deep) part of the CMZ whereas the majority of Cyclin D2+ cells are localized in the basal (superficial) aspect of the CMZ.
D. Schematic drawing summarizing the domains of the CMZ delineated by the expression of BMP4 (grey), Msx1 and Cyclin D2 (blue).
E–E´. Initial and final frames of a time-lapse sequence from a ventral retinal section of a E14.5 Tg(Zic2eGFP) embryo. Circles in E and E´ indicate the initial and final position of the tracked cells respectively. Yellow circles indicate cells that follow a radial trajectory and blue circles cells that follow a lateral trajectory (see panels F-H).
F. Representative examples of cell trajectories in a retinal section. Note that the majority of the cells showing a lateral trajectory (blue tracings) are located in the basal region of the proximal CMZ (Msx1+ region, indicated in blue in the diagram)
G. Scheme to describe the criteria for categorizing individual cell trackings into radial or lateral trajectories. The CMZ was divided into two regions: the distal (65 µm from the tip,) and the proximal region (75 µm towards the central retina) by drawing a line parallel to the retinal surface (grey and blue lines respectively). A line perpendicular to the surface of the retina (orange line) was defined by the apico-basal columns of progenitors visualized by eGFP staining. The proximal region was divided into three segments by drawing three equidistant lines 25 µm apart at the basal surface of the retina (blue line) and three equidistant lines of 50 µm at the apical surface (green line). Dashed-grey lines limit each segment, and were used as a reference where to align 90° angles in each segment.
H. Individual cell trackings were classified within each segment according to the angles defined in panel G. Cells moving in a trajectory with an angle between 0 and 45° from the vertical axis were categorized as radially migrating, and cells with an angle between 45° and 90° were categorized as laterally migrating.
I. Quantification of radial and lateral trajectories of tracked cells within the distal and the proximal regions of the CMZ. Cells arising from the most distal region of the CMZ display a radial trajectory, whereas a significant number of cells arising from the proximal region of the CMZ move laterally.
Scale bar 50 µm.

