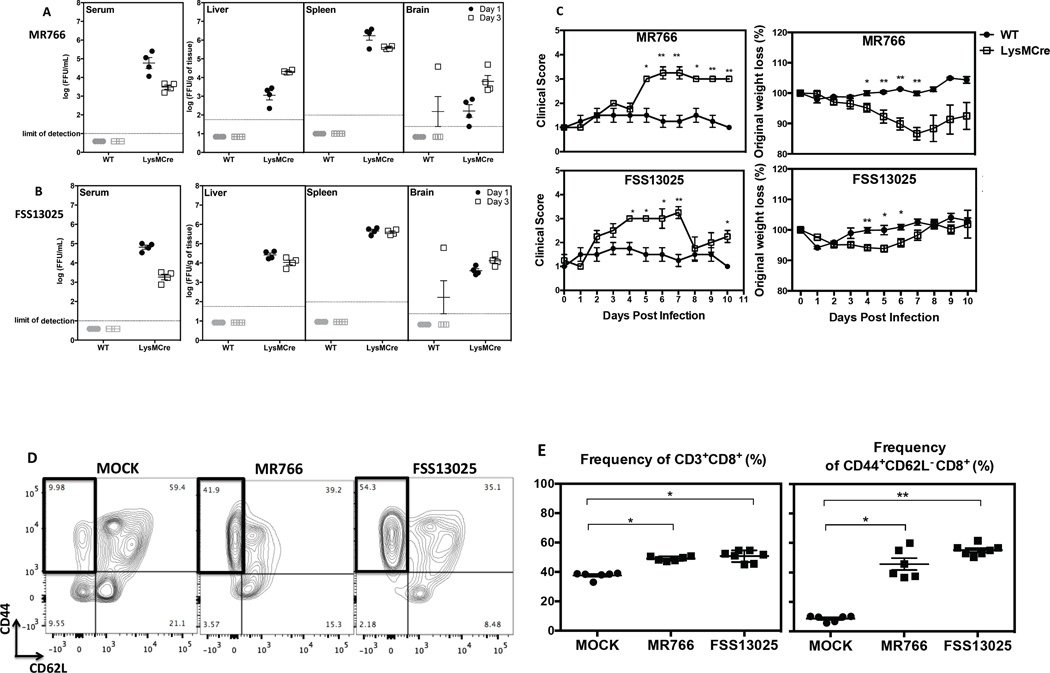
Figure 2. The LysMCre+IFNARfl/fl mouse model of ZIKV infection.
WT and LysMCre+IFNARfl/fl C57BL/6 mice at 5 weeks of age were infected with 106 FFU of MR766 or FSS13025. Serum, liver, spleen, and brain were harvested at day 1 and 3 post-infection, and the levels of infectious ZIKV were determined using BHK-21 cell-based FFA. The quantities of infectious (A) MR766 or (B) FSS13025 virus at day 1 (black circles) and day 3 (white squares) post-infection are shown. Four mice were included in each group. (C) Weight and clinical scores of infected WT and LysMCre+IFNARfl/fl mice were monitored and unpaired t test with Welch’s correction was used to compare the two groups at each time point. (D) A representative density plot showing CD44 and CD62L expression and (E) the frequency of CD3+CD8+ T cells and CD44+CD62L− CD8+ T cells from LysMCre+IFNARfl/fl mice infected with 104 FFU of ZIKV or MOCK are shown. Kruskall Wallis test was used first to compare all groups and the Mann-Whitney test was used to compare MOCK and each ZIKV-infected group. All error bars correspond to SEM.

