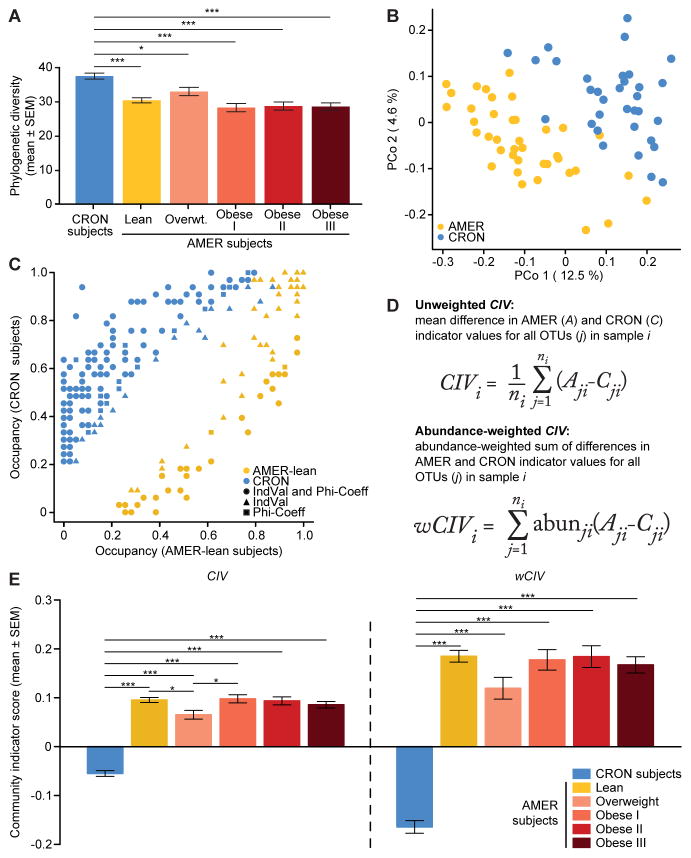
Figure 1. Fecal microbiota of CRON and AMER human subjects.
(A) Faith’s phylogenetic diversity (PD) values in CRON and AMER subjects. (B) PCoA of unweighted UniFrac distances in CRON and lean AMER subjects. (C) Frequency of occurrence (occupancy) of dietary practice (DP)-associated OTUs in CRON and lean AMER subjects. Different colors denote different DPs. Different shapes denote which analyses [indicator value (IndVal) and phi-coefficient] detected significant DP associations for each OTU. (D) Mathematical formulae calculating unweighted and weighted community indicator values (CIV and wCIV). (E) CIV and wCIV values in CRON and AMER subjects. Least-squares means comparisons (following a linear mixed-effects model) identified statistically significant differences in PD, CIV, and wCIV, between subject groups. P-values were adjusted for multiple comparisons according to Holm’s method; *, P<0.05, **, P<0.01, ***, P<0.001. See also Figure S1.

