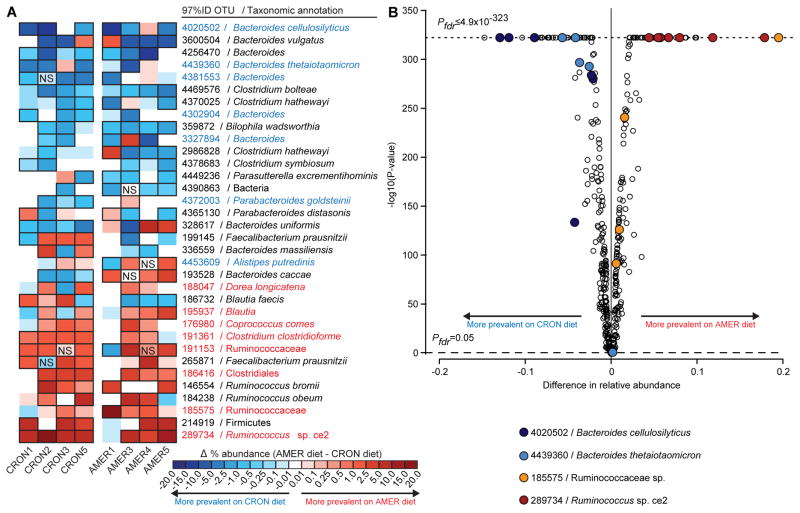
Figure 3. Effects of diet on the relative abundances of individual OTUs in the fecal microbiota of AMER-colonized and CRON-colonized mice.
(A) A heatmap shows differences in mean relative abundances of OTUs, for each transplanted human donor community, between recipient mice fed the AMER diet (ad libitum) and those fed the CRON diet (restricted). Cells outlined in black represent significant differences (P<0.05; NS, non-significant differences). AMER-associated and CRON-associated OTUs are highlighted in red and blue text, respectively. (B) A volcano plot shows the significance and magnitude of differences in the relative abundances of OTUs between the diet treatments, as defined Cochran-Mantel-Haenszel tests followed by FDR correction of P-values. PFDR-values of zero are plotted as ≤4.9×10−323 (minimum non-zero value calculated by the R software package). Only OTUs with a mean relative abundance of 0.5% in at least one diet context were included in the analysis. Samples collected from experimental days 15 to 56 following gavage of the indicated donor communities are included in the analysis.

