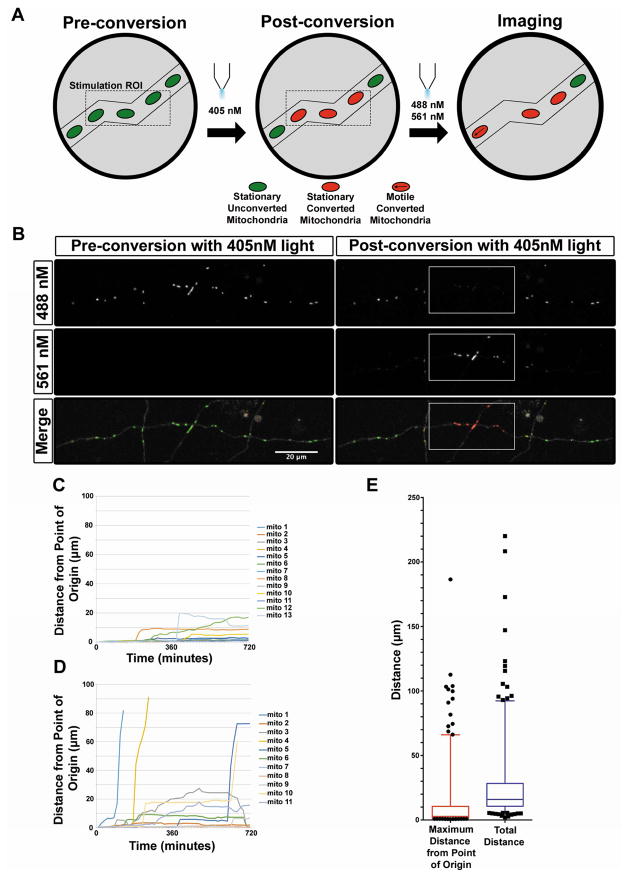
Figure 3. Long-term time lapse microscopy with photo-convertible mEos2 reveals highly stable mitochondria in mature axons in vitro.
(A) Schematic representation of long-term time lapse imaging setup. Upon photo-conversion of mito-mEos2, all mitochondria within a short segment of the axon (30 to 50 μm) were converted from green to red fluorescence. Timelapse imaging was then performed every 15 minutes for 12 hours for both the red and green forms of mEos2. (B) A 28 DIV cortical axon expressing mito-mEos2 before and after photo-conversion by 405nm light. White boxes label the ROI for 405nm stimulation. (C) Graph of individual photo-converted mitochondrial motility in a representative axon with low mitochondrial motility. (D) Graph of individual photo-converted mitochondrial motility in an axon with higher mitochondrial motility. (E) Quantification of maximum distance from the point of origin and total distance moved for each mitochondria tracked over 12 hours revealing that 75% of mitochondria moved 10 microns or less from their original positions. N = 261 mitochondria from 23 axons (4 independent cultures). Data in E is represented as 5–95% whisker box plots with 25th, 50th, and 75th percentiles shown by the lower, middle and top of the boxes. Outliers are represented by black dots. See also Movie S3.

