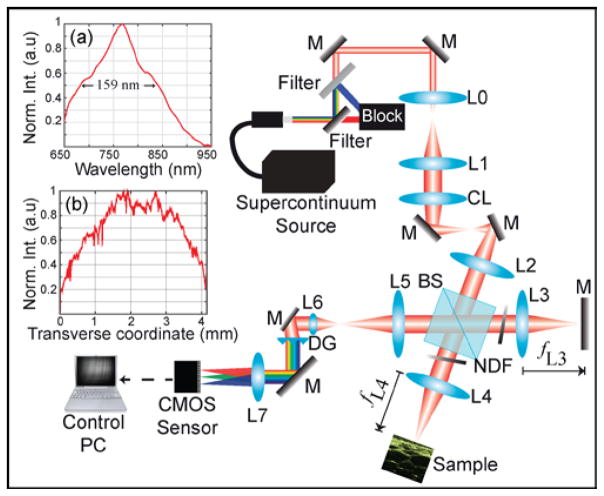
Fig. 1.
Illustration of the parallel SD-OCT system (Horizontal plane shown; see Ref. [11] for the vertical plane). M, mirror; NDF, neutral density filter; L, lens; BS, beam splitter. Panels (a) and (b) plot the spectrum and the transverse intensity distribution of the beam, respectively, both at the sensor plane with the sample arm blocked.

