
Figure 2.
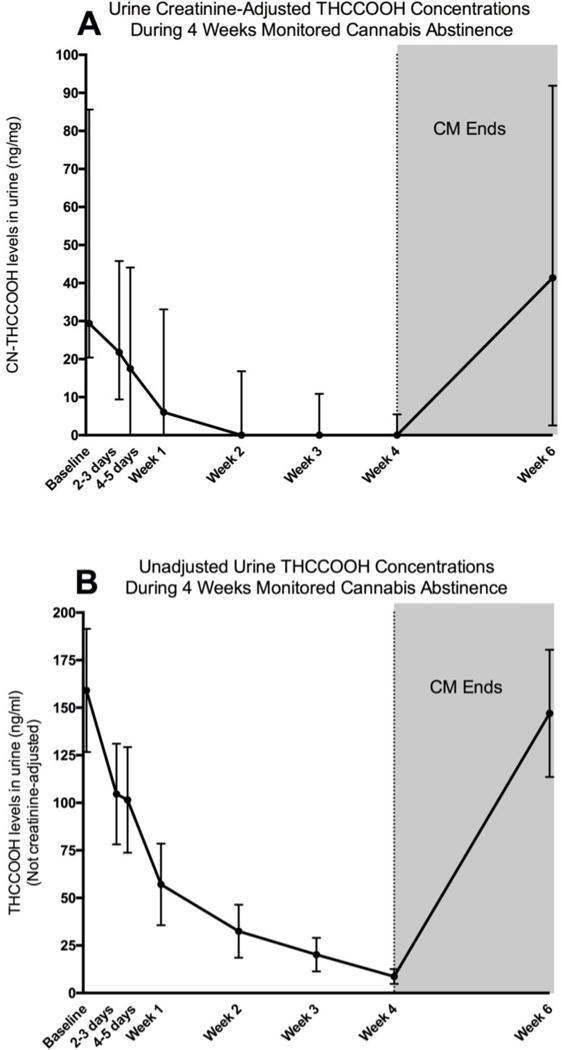
A. Urine creatinine-adjusted THCCOOH concentrations declined during four weeks of monitored cannabis abstinence. All values represent medians and interquartile ranges. Values are only presented for the participants who provided urine samples with THCCOOH values under the limit of detection (500ng/mL). B. Unadjusted THCCOOH concentrations declined during four weeks of monitored cannabis abstinence. All values represent means and standard errors. Values are coded as “501” for participants with urine THCCOOH values over the limit of detection (500ng/mL).