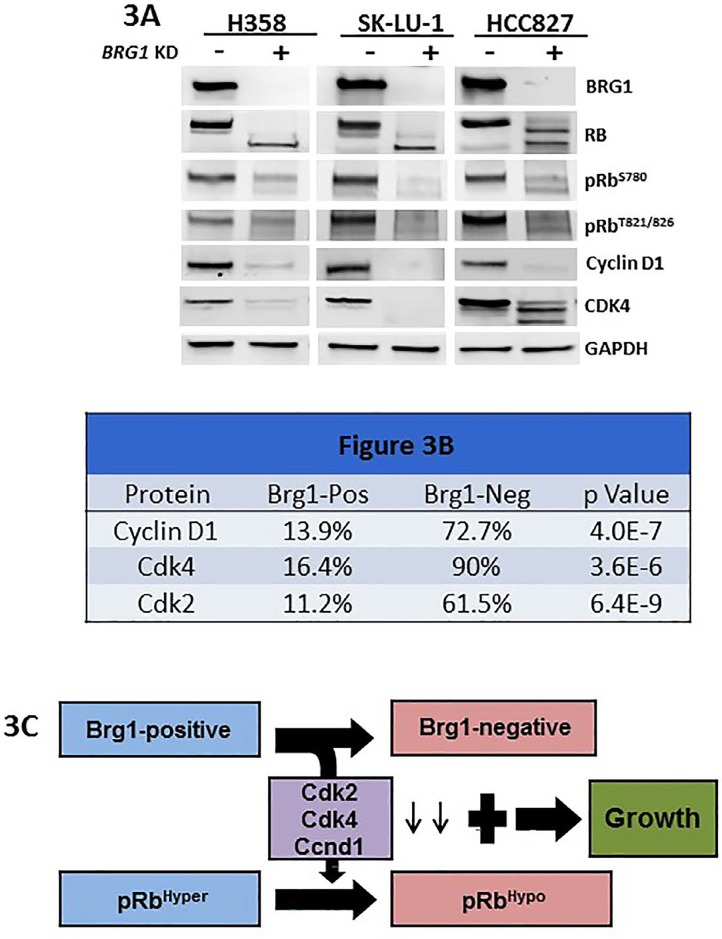
Figure 3. Figure 3A shows the protein expression levels as measured by western blot with antibodies to BRG1, RB1, pRB1S780, pRB1T821/826, CCND1, CDK4 and GAPDH for the three human cell lines H358, SK-LU-1 and HCC827 with (+) and without (−) BRG1 knockdown.
Also shown is the effect of BRG1 suppression by shRNA knock down on RB1 phosphorylation. Cell proliferation persists (before or after BRG1 knock down) since either RB1 or BRG1 is inactivated and therefore cannot cooperate to foster RB1-mediated growth inhibition in either situation. Figure 3B shows the results of dual IF for Brg1 and Ccnd1 in the top row and the results for dual IF between Brg1 and Cdk4 and Brg1 and Cdk2 in the middle and bottom rows, respectively; p values for these comparisons are given in the column on the far right. Figure 3C illustrates the changes in Cdk2, Cdk4 and Ccnd1 as a function of Brg1 loss and how the loss of Brg1 potentially allows the Brg1-negative tumor cells to continue to grow, despite being in its active growth-inhibitory state.

