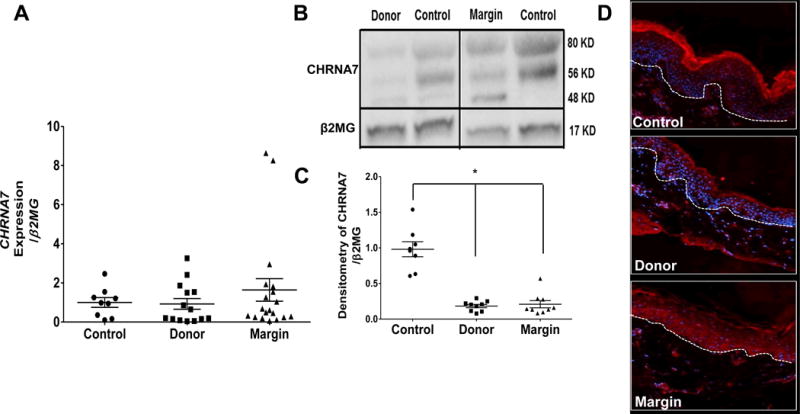
Fig. 1. Gene expression and protein levels of CHRNA7 in skin from control and burn patients.

(A) Gene expression of CHRNA7 in control, donor, and burn margin skin; n=9–19/group. (B–C) Protein levels of CHRNA7 in control, donor, and burn margin skin by Western Blot analysis; n=8–9/group. *p< 0.001 vs. control using Mann-Whitney U test. (D) Protein levels of CHRNA7 by IHC; Red: CHRNA7; Blue: DAPI; the white dashed line designates the epidermal-dermal junction; n=10/group. Magnification 20×.
