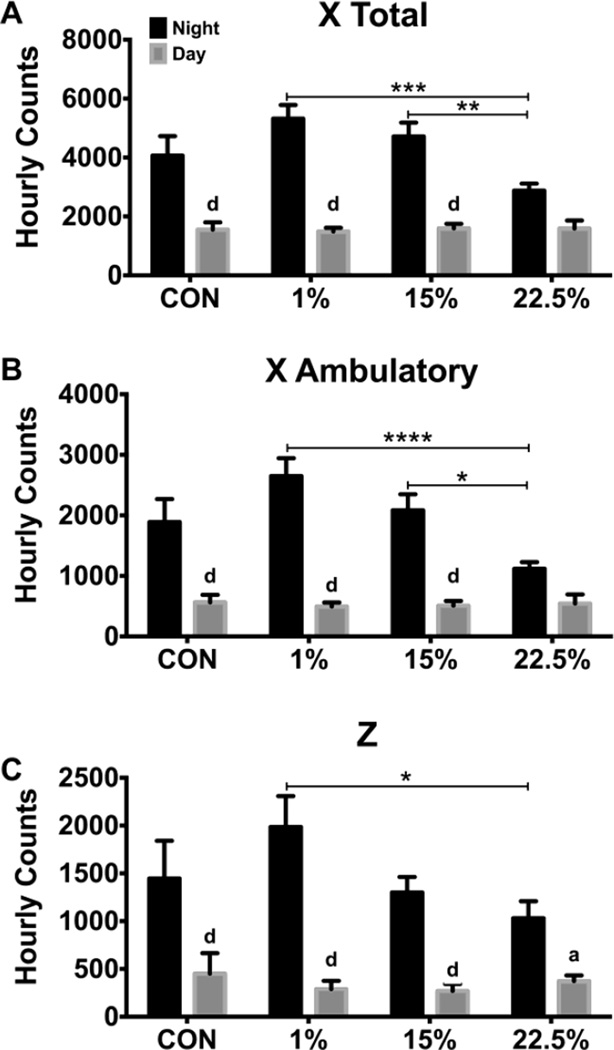
Fig. 4.
Nighttime movement was reduced by LA. (A) Average nighttime (black bars) and daytime (grey bars) beam breaks in the X plane. (B) Average nighttime and daytime novel beam breaks, indicating movement (ambulation) in the X plane. (C) Average nighttime and daytime beam breaks in the Z plane. Data (n=10) were analyzed by a repeated measures, two-way ANOVA with Bonferroni-Dunn multiple comparisons test. Asterisks denote comparisons between diets and letters denote comparisons within diets (a,* p<0.05; b,** p<0.01; c,***p<0.001; d,**** p<0.0001).

