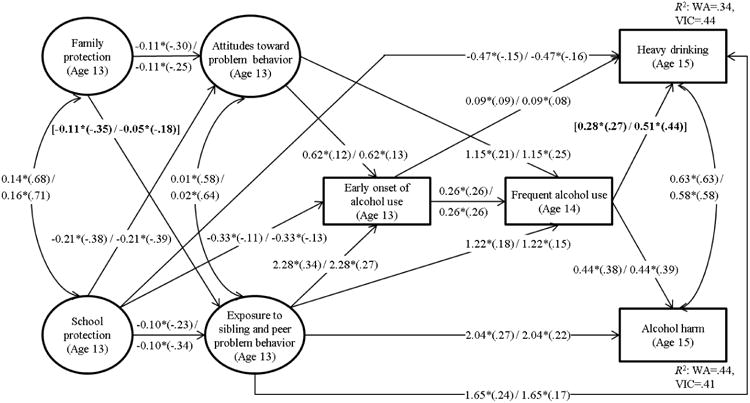
Figure 2.

Statistically significant path coefficients from the final structural equation model for Washington State and Victoria students. WA = Washington State; VIC = Victoria.
Note: Unstandardized coefficients are presented with standardized coefficients in parentheses, first for Washington and then for Victoria; path coefficients that were freely estimated across two states are in brackets; analysis sample size for Washington State is 923, and 910 for Victoria; family and school protection, attitudes toward problem behavior, and exposure to risky environment; heavy drinking and alcohol harm variables were freely correlated; all variables were regressed on gender and SES, and results for control variables are presented in Table 5.
*p < .05 or better
