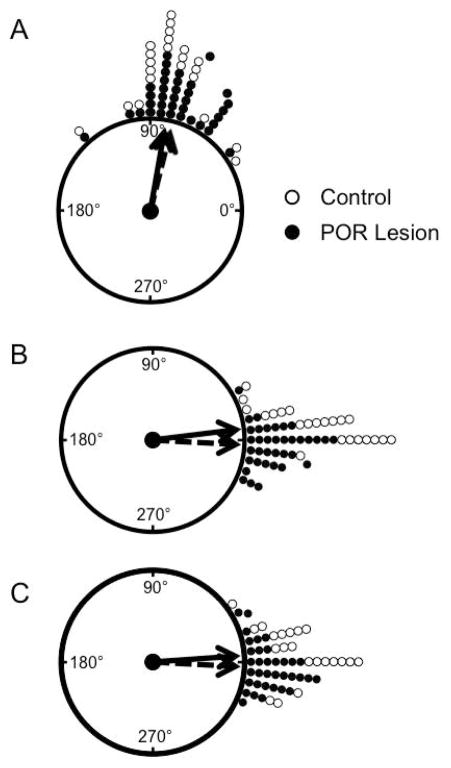
Figure 3.
Landmark Cue Rotation. Following a 90° cue rotation (A), HD cells tended to shift in register with the cue card in both POR lesioned and control animals. B–C) When the cue was returned to its original position, HD cell PFDs similarly shifted back to their original orientation in both groups following the rotation (B) and dark (C) sessions. POR lesion: filled circles, solid line; Control: open circles, dashed line. Arrows represent the mean resultant vector.

