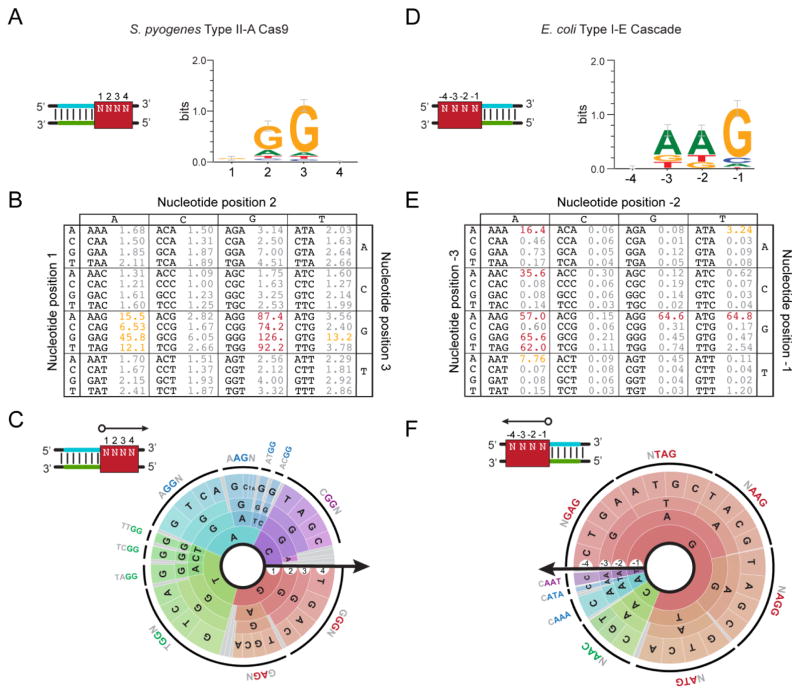
Figure 5.
Reporting the CRISPR PAM. (A–C) Visualizing the PAM for the S. pyogenes Type II-A system. The reported PAMs are based on data from the plasmid-clearance method conducted by Kleinstiver and coworkers [72]. (D–F) Visualizing the PAM for the E. coli Type I-E system. The reported PAMs are based on data from the DNA-binding method conducted by Leenay and coworkers [64]. (A) The consensus sequence and sequence logo. The consensus sequence represents a compilation of all highly-active functional PAM sequences. The sequence logo displays the sequence conservation of each base at each position in functional PAM sequences [89]. The red box demonstrates the PAM location assuming a guide-centric orientation (see Figure 2). (B) The PAM table. The table displays the enrichment or depletion scores from the conducted screen for each possible sequence. Higher values represent more active PAMs. PAMs with similar activities are colored. (C) The PAM wheel. Individual sequences are read following a radius of the circle. The arrow shows the orientation of each base in relation to the protospacer. The larger the radian occupied by the sequence, the greater its enrichment or depletion score. The outer ring depicts a common functional PAM sequence. PAM wheels are also available as interactive .html files [64].

