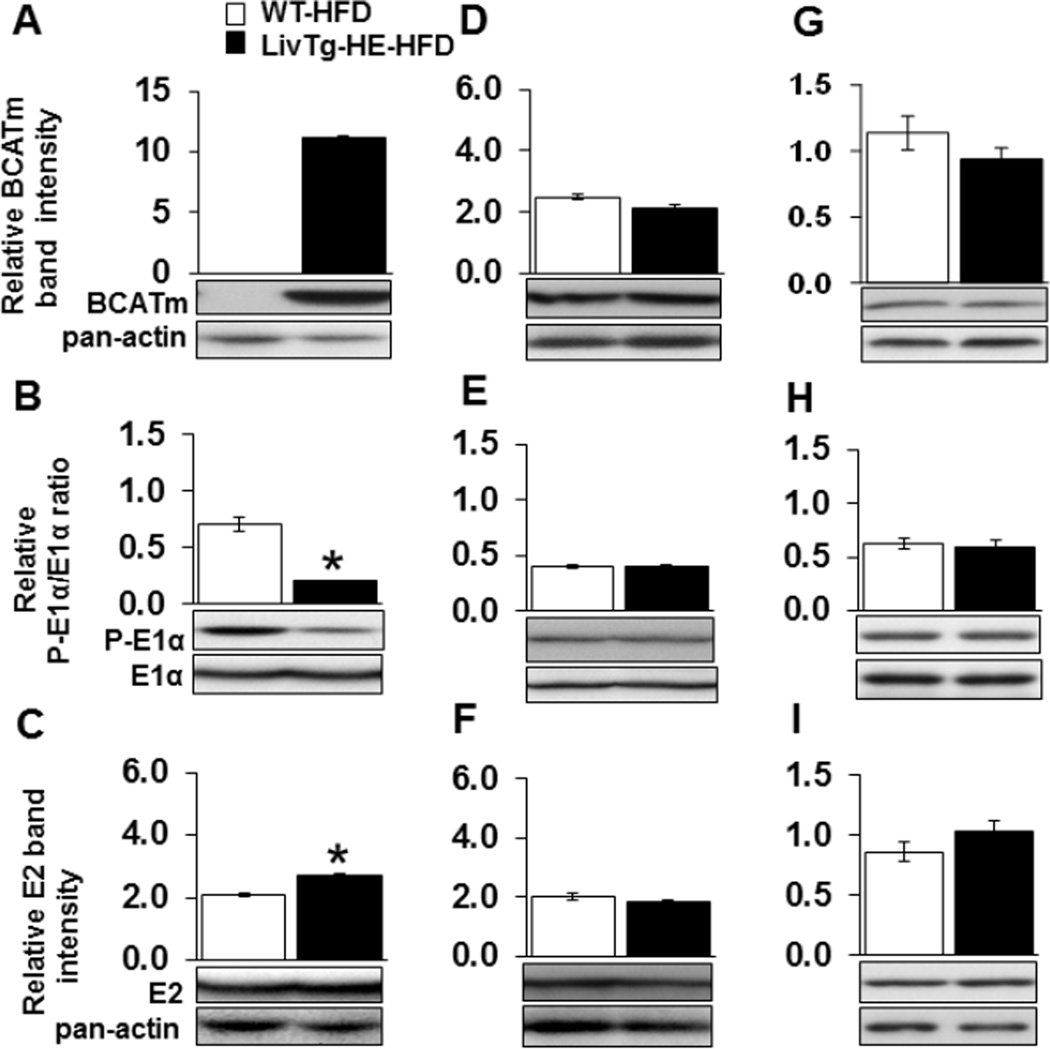
Fig. 5.
Expression of BCATm raises BCKDC activity in the mouse liver under high fat diet feeding. BCATm (A,D,G), E1α and P-E1α (B,E,H), and E2 (C,F,I) were determined by Western Blotting in liver (A,B,C), muscle (D,E,F), and heart (G,H,I) tissues of WT (white bar) and LivTg-HE (black bar) consuming a high fat diet (HFD). For E1α, each graph shows the relative ratio between the phosphorylated and total E1α protein. For BCATm and E2, each graph shows the relative band intensity normalized to pan-actin. Data represent mean ± SEM, n=6 male mice, age 24 weeks. *P≤ 0.05 as compared to WT.

