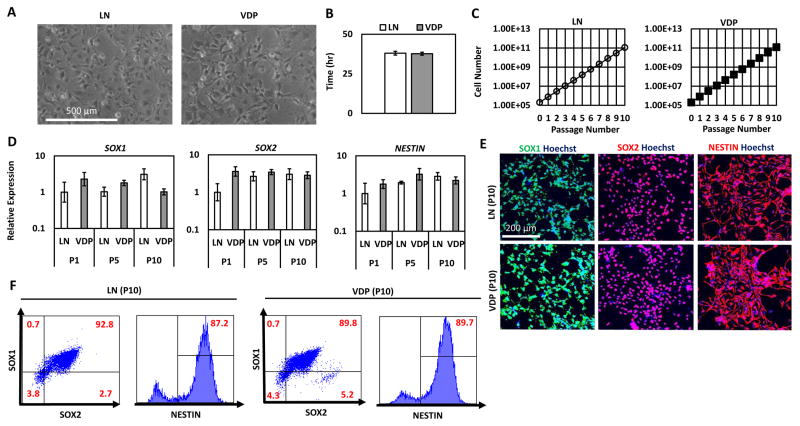
Figure 4. Long-term expansion of hNPCs on VDP-coated surfaces.
(A) Representative phase contrast images of H9-hNPCs cultured on LN and VDP surfaces for 10 passages (scale bar = 500 μm). (B) Doubling time of H9-hNPCs cultured on LN and VDP. Data is presented as the mean ± S.D of the doubling time over the course of 10 passages. There was no statistical difference in the doubling time of hNPCs grown on LN and VDP (Student’s t-test, p>0.05) (C) H9-hNPCs were cultured on LN and VDP and cell growth was analyzed by cell count at each passage (mean ± S.E.M). (D) Quantitative PCR analysis for expression of hNPC multipotency markers SOX1, SOX2, and NESTIN in H9-hNPCs cultured on LN and VDP for 1, 5, and 10 passages (mean ± S.E.M). Two-way analysis of variance (ANOVA) revealed that there was no statistical difference (p>0.05) in expression of these genes over the course of 10 passages in hNPCs cultured on LN- or VDP-coated surfaces. (E) SOX1, SOX2, and NESTIN immunofluorescence of H9-hNPCs cultured on LN and VDP for 10 passages (scale bar = 200 μm). (F) Flow cytometry analysis for SOX1, SOX2, and NESTIN expression in H9 hNPCs cultured on LN and VDP for 10 passages. Gates were determined using isotype controls. Isotype controls used are listed in Supplementary Table 3.

