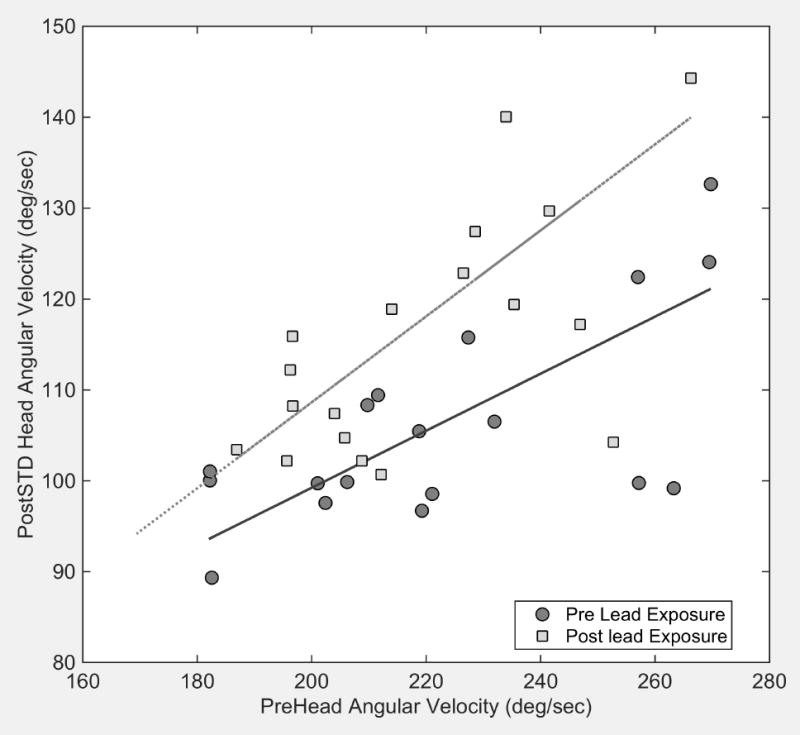
Figure 1.

Greater variability of angular head velocity is associated with larger magnitudes of angular head velocity in pre exposed mice (dark gray circles). The solid line is a linear regression of these data (slope=0.31, r2=0.66). Following exposure to lead, the variance of angular head velocity is increased (light gray squares) relative to pre exposure values in the same mice as shown by the linear regression of the post exposure data (gray dashed line, slope=0.47, r2=0.75)
