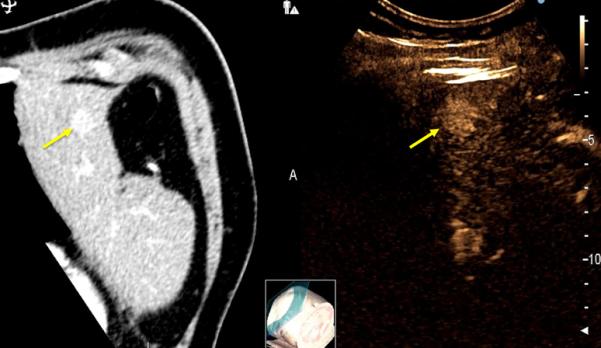
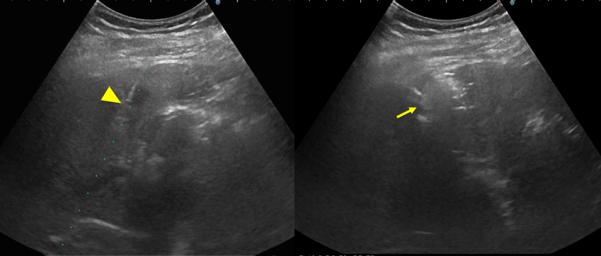
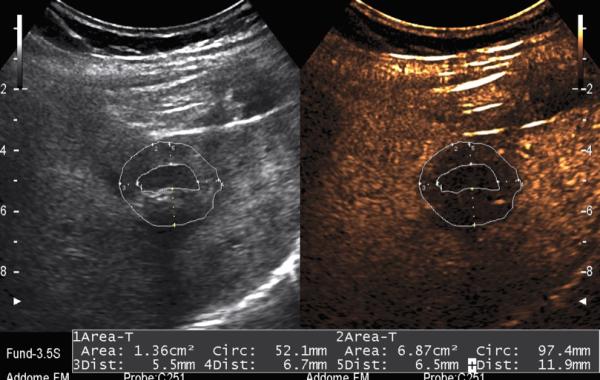
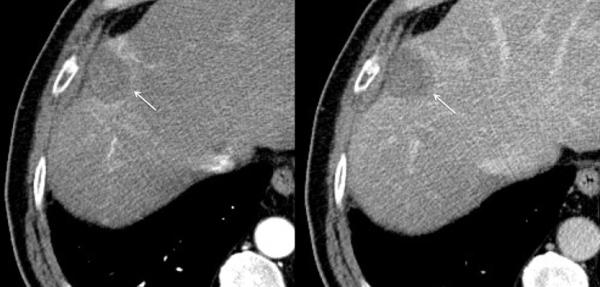
Figure 3.


79-year old male with a history of cirrhosis and hepatitis C and prior treatment with surgery and radiofrequency ablation for HCC. A) CECT (left) and CEUS (right) image demonstrating an arterially-enhanced liver lesion (yellow arrows). B) Ultrasound image showing single gas cooled-antenna (arrowhead) being guided into the HCC (left) and after being treated at 50 W for 5 minutes (right). This ultrasound image shows progression of treatment via rapid generation of gas inside the liver tissue (arrow). C) On post-procedural B-mode (left) and CEUS (right) (24-hour post-ablation), the image shows presence of central hypo-echoic area corresponding to the lesion treated, surrounded by a hyper-echoic area which corresponds to the inflammatory region of the ablation zone. D) 24-hour post-ablation arterial phase CECT (left) and portal-venous phase CECT (right) showing ablation zone encompassing the lesion (arrows).
