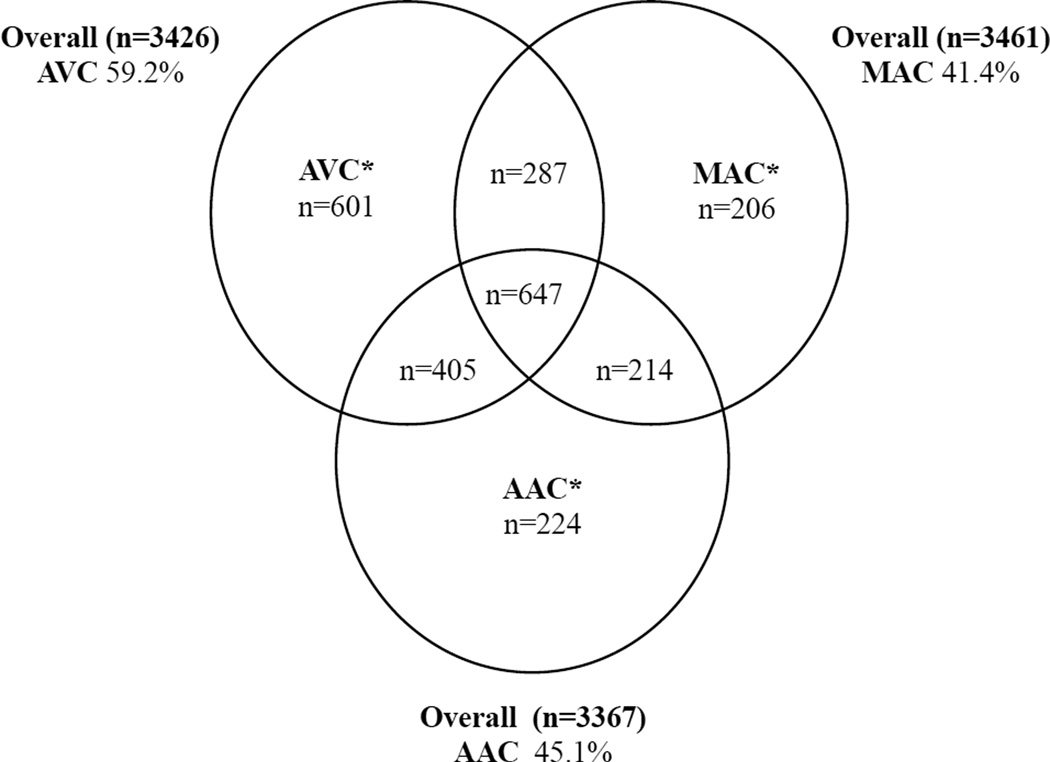
Figure 2.
Venn diagram of participants with AVC, MAC, and AAC alone or in combination. The total number of participants in the baseline analysis (original and supplemental cohorts) with each calcification measure after exclusion of those with missing covariate or biomarker data is provided outside the Venn diagram, along with the proportion having positive calcification. Values inside the Venn diagram (*) are for the subset of these participants with information on all three cardiac calcification measures, and give the number of participants having positive calcification for each of these measures, alone and in combination.

