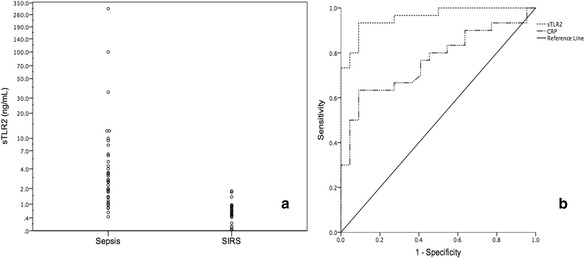
Fig. 1.

Individual sTLR2 levels in the sepsis and SIRS groups (a) and receiver operating characteristic curve (ROC) for the ability of sTLR2 and CRP levels to diagnose sepsis (b). Area under the curve (AUC) for sTLR2 0.959; 95% CI 0.912–1.000; AUC for CRP 0.764; 95% CI 0.635–0.894
