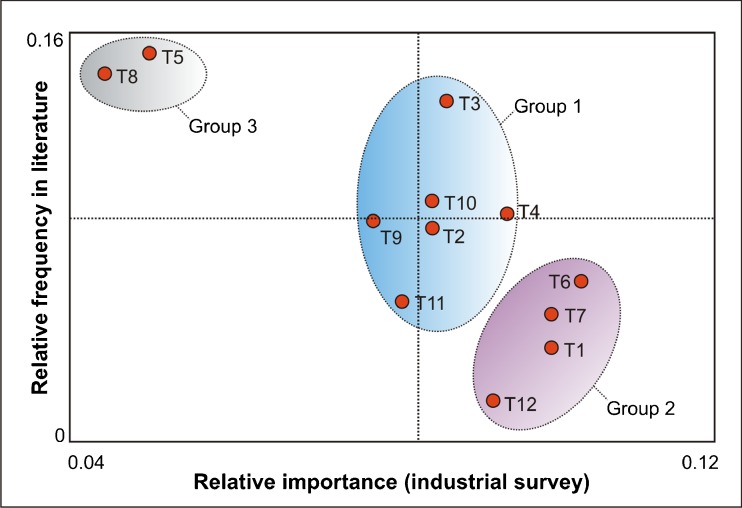
Fig. 6.
Comparison between the relative frequency of a tool reported in the literature and the relative importance rating addressed by the industrial questionnaire. Group 1 represents the technologies which are recognized as being modestly important by the respondents of the survey, and also receive a significant amount of attention from the academic community. The technologies included in Group 2 are ranked as relevant by the industry but not congruently represented in the literature. The technologies included in Group 3 are perceived as less important by the industry yet addressed highly by the scientific community. Mean values are shown as dotted lines. T1: Capture tools, T2: Retrieval tools, T3: Data mining, T4: Data and knowledge bases, T5: Taxonomies and ontologies, T6: Visualization tools, T7: Statistical analyzers, T8: Intelligent agents, T9: Models and simulation, T10: Network and web technologies, T11: Collaboration tools, and T12: Document management systems.

