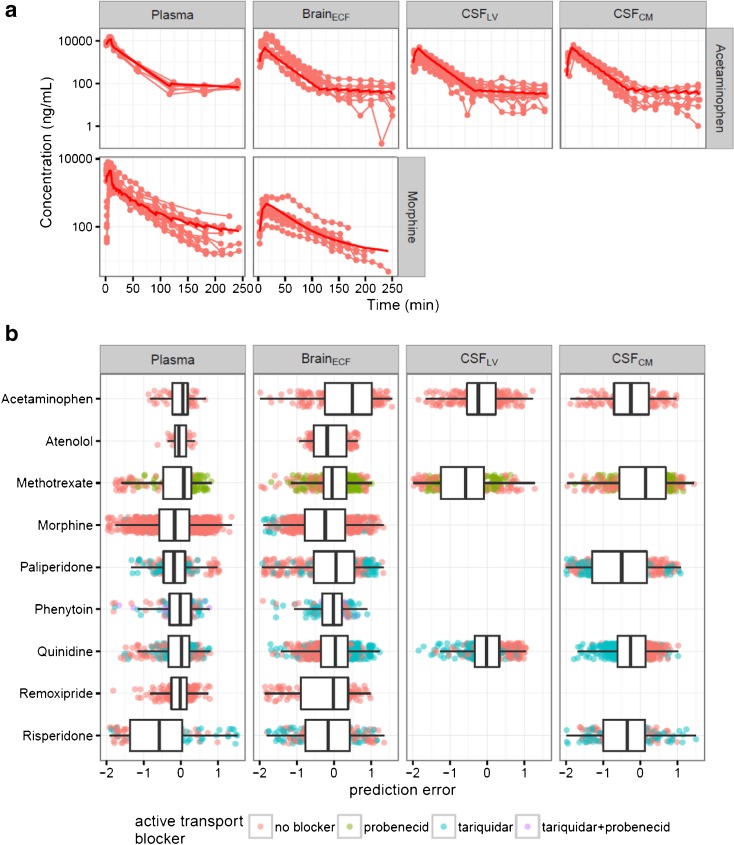
Fig. 4.
Prediction of the multi-compartmental brain PK model. (a) Individual observed drug concentrations (lines and circles) and mean model prediction (solid lines). Unbound concentration (ng/mL) versus time (min) profiles for acetaminophen and morphine. (b) Box-whisker plots for the prediction errors across all nine drugs evaluated. The plots were stratified by brain compartments (panels) and by active transport blockers (colors).

