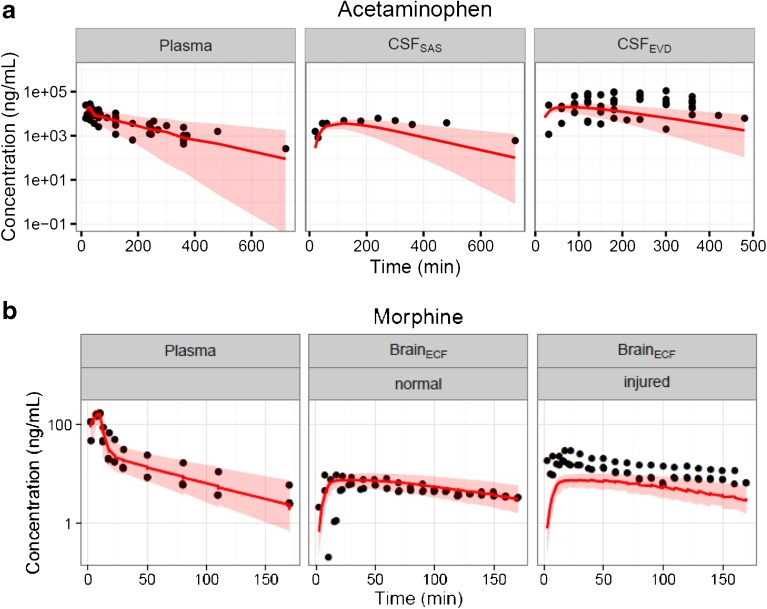
Fig. 6.
Human brainECF and CSF concentration-time profiles (circles) and prediction from the translational model (red lines: median, shaded area is 95% prediction interval). (a) Acetaminophen data was obtained from plasma, CSFSAS and CSFEVD, (b) morphine data was obtained from plasma and brainECF in “normal” brain and “injured” brain. The x-axis represents the time in minutes and the y-axis represents the acetaminophen and morphine concentration in ng/ml. The panels are stratified by brain compartments and brain conditions.

