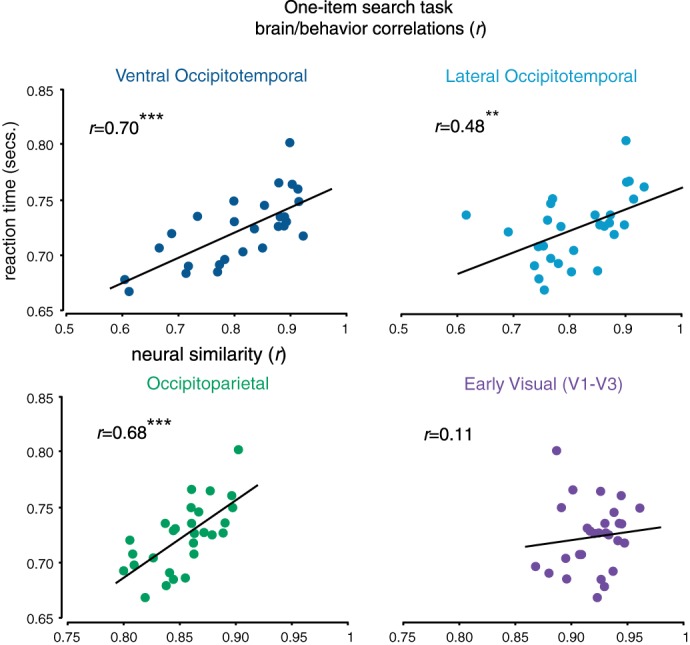
Fig. 10.

Group-level brain/behavior correlations in each macroscale sector. Each dot corresponds to a particular category pairing (e.g., faces and hammers). Reaction times for each category pairing are plotted on the y-axis, while the similarity of the neural responses for those category pairings are plotted on the x-axis. Note the change in scales of the x-axes between the occipitotemporal sectors and the occipitoparietal/early visual sectors. **P < 001, ***P < 0001.
