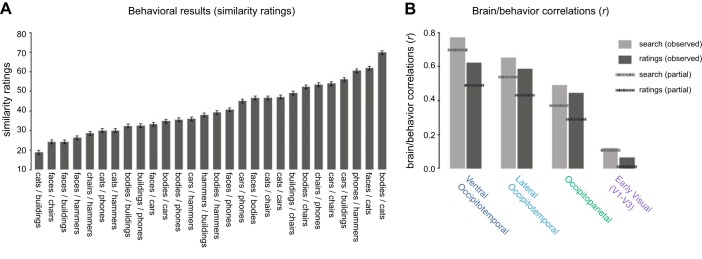
Fig. 11.
A: explicit similarity ratings for all category pairings. Average similarity rating is plotted on the y-axis as a function of category pairing along on the x-axis. Error bars reflect within-subject standard error of the mean. B: group-level brain/behavior correlations in each macroscale sector for both the search task and the rating task. The solid bars indicate the observed correlations, while the dashed lines indicate the partial correlations for each behavioral task after factoring out the other [e.g., “search (partial)” indicates the correlations between the search task and the different neural regions after factoring out the rating task].

