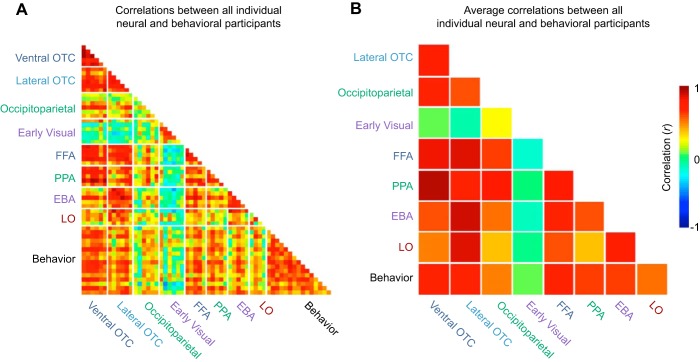
Fig. 8.
A: individual-by-individual correlations between every neural (N = 6) and behavioral (N = 16) participant. Each cell corresponds to the correlation between two different participants. Instances in which there are only five rows or columns for a given region reflect instances when that region was not localizable in one of the participants. B: average correlation across all pairs of participants for a particular comparison. For example, the cell corresponding to ventral occipitotemporal and lateral occipitotemporal cortex is the average of all possible individual-by-individual correlations between those two regions. The cell corresponding to ventral occipitotemporal cortex and behavior is the average of 96 individual-by-individual correlations.

