Fig. 1.
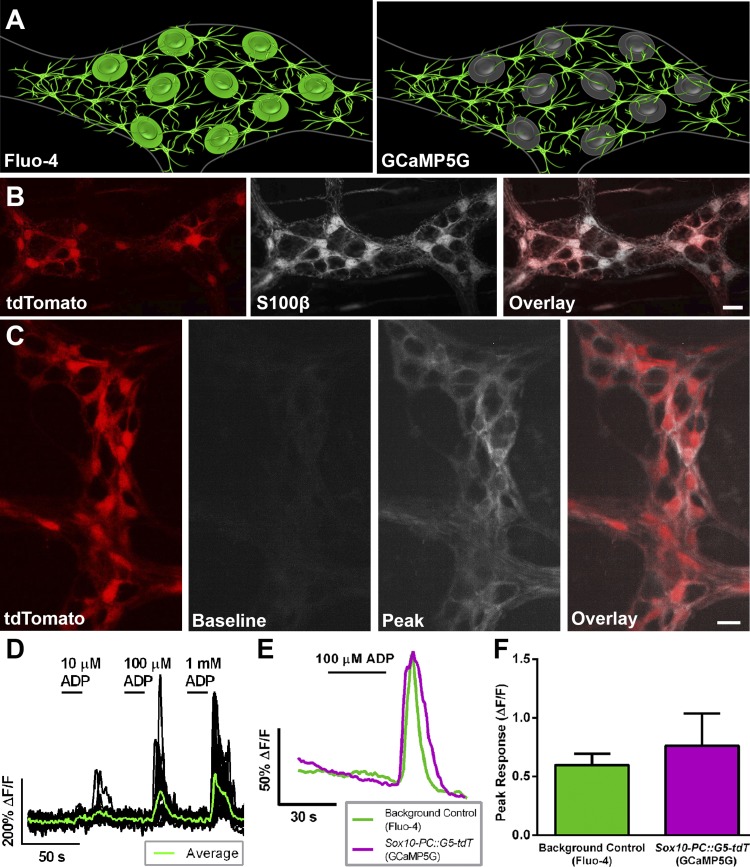
Sox10-PC::G5-tdT transgenic mice are an effective model to study glial [Ca2+]i responses specifically in the enteric nervous system. A: model of our experimental paradigm comparing Fluo-4 and GCaMP5G imaging in the colonic myenteric plexus. Note that Fluo-4 loads both enteric neurons and glia, whereas GCaMP5G expression is isolated to enteric glia in our genetic model. B: representative epifluorescence images showing the specific expression of tdT (red, left) in S100β-immunoreactive enteric glia (grayscale, middle) in the colonic myenteric plexus of Sox10-PC::G5-tdT mice (overlay, right). C: representative still images from a Ca2+ imaging experiment showing GCaMP5G fluorescence (grayscale, middle 2) in enteric glia (identified by tdT fluorescence; red, left) in a myenteric ganglion from a Sox10-PC::G5-tdT mouse. GCaMP5G fluorescence is low at rest (baseline) and increases robustly when glial [Ca2+]i responses are stimulated by ADP (100 μM; peak). Note that [Ca2+]i responses are limited to tdT-positive glial cells (overlay, right). D: representative traces of [Ca2+]i levels in enteric glia (black traces) within a myenteric ganglion (averaged response of all glia within ganglion, overlaid in green) from Sox10-PC::G5-tdT mice exposed to an ADP dose-response curve (10 µM, 100 µM, and 1 mM, subsequently). ΔF/F, change in fluorescence. E: representative traces comparing the mean [Ca2+]i responses of myenteric glia with ADP recorded using GCaMP5G fluorescence of n = 20 glia from a single myenteric ganglion from Sox10-PC::G5-tdT mice (magenta) or traditional Fluo-4 loading of n = 17 glia from a single myenteric ganglion from background control animals (green). F: GCaMP5G fluorescence reports an average peak [Ca2+]i response that is comparable with those reported by Fluo-4. Peak responses are the average of all glia within a myenteric ganglion exposed to ADP of n = 6–7 ganglia from at least 3 mice. Scale bars = 10 μM.

