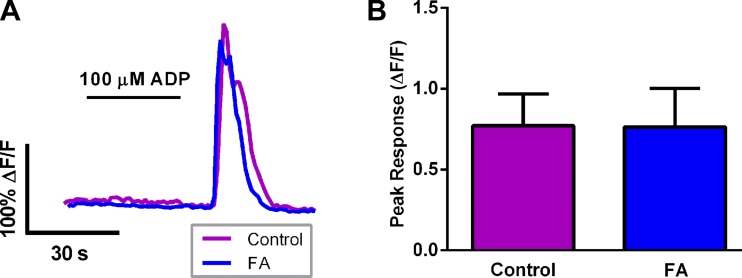
Fig. 2.
The effect of fluoroacetate (FA) on averaged ganglionic glial [Ca2+]i responses triggered by ADP in Sox10-PC::G5-tdT mice. A: representative traces showing the average [Ca2+]i response of all glia within a myenteric ganglion driven by ADP (100 μM) in control samples (magenta) or samples exposed to FA (5 mM, blue). The control trace is the averaged response of n = 20 glia within a single myenteric ganglion, and the FA trace is the averaged response of n = 26 glia within a single myenteric ganglion. B: quantification of the effect of FA on peak glial [Ca2+]i responses driven by ADP. Data are expressed as an averaged response of all glia within a myenteric ganglion (averaged ganglionic response) of n = 9 ganglia from at least 5 mice.

