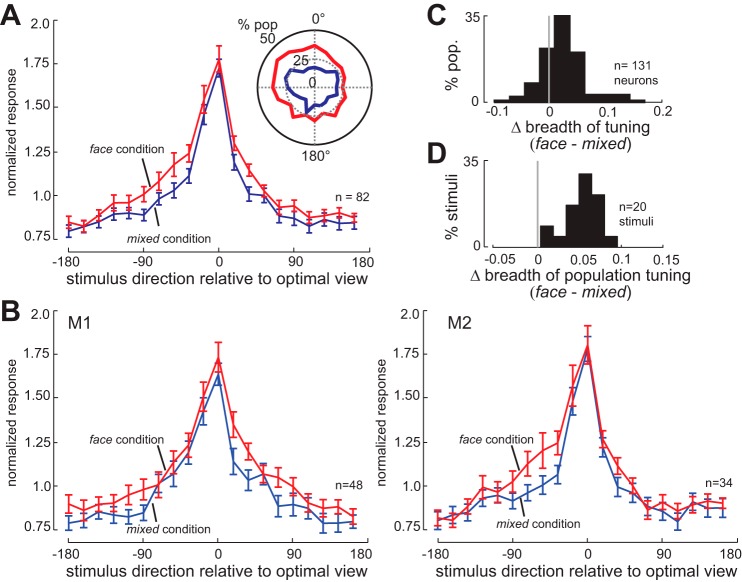
Fig. 3.
Stimulus context alters population and neuronal breadth of tuning. A: normalized responses of the population of 82 view-tuned IT neurons to 20 views of face stimuli, ordered relative to their optimal viewing angle, for the face condition (red) and the mixed condition (blue). Neurons respond more strongly to suboptimal viewing angles in the face condition. Inset: polar plot of proportion of neurons (out of 131 neurons) responsive to each of 20 presented face views in face (red) and mixed (blue) conditions. A larger proportion of the IT population responds to each face view in the face condition. B: normalized responses of 48 view-tuned neurons from monkey 1 (M1; left) and 34 view-tuned neurons from monkey 2 (M2; right) to 20 views of face stimuli, ordered relative to their optimal viewing angle, for the face condition (red) and the mixed condition (blue). Neurons in both monkeys respond more strongly to suboptimal viewing angles in the face condition. C: histogram of the change in neuronal breadth of tuning for face views (face condition − mixed condition) for all 131 face-responsive IT neurons. A positive mean indicates that neurons are responding to a larger fraction of the face stimuli in the face condition. D: histogram of change in population breadth of tuning (face condition − mixed condition). A positive mean indicates that each stimulus is activating a larger fraction of the neuronal population in the face condition.

