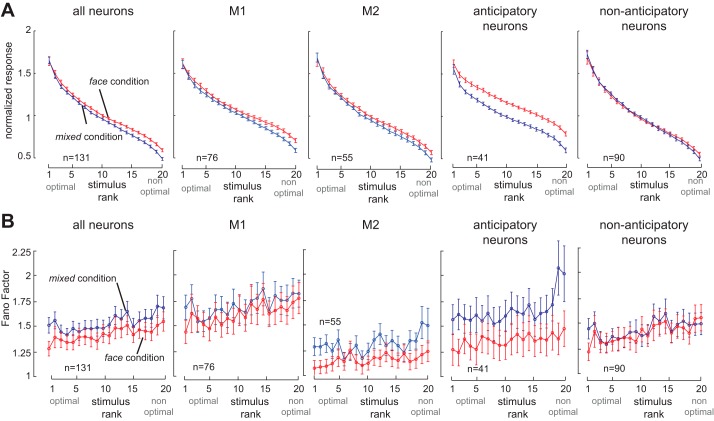
Fig. 5.
Relationship between changes in baseline and stimulus-evoked activity. A: normalized responses of IT neurons to 20 different face views, arranged in order of stimulus rank (from highest to lowest visually evoked response for each neuron), in the face (red) and mixed (blue) conditions. From left to right, plots show all 131 face-responsive neurons, 76 neurons from monkey 1 (M1), 55 neurons from monkey 2 (M2), the 41 neurons with anticipatory activity prior to the stimulus-evoked response in the face condition (across both monkeys), and the 90 neurons lacking significant anticipatory activity. Changes in stimulus-evoked activity are most pronounced in neurons that also display anticipatory response enhancement. B: response variability (Fano factor) of IT responses to the 20 face views, arranged by stimulus rank as described for A. From left to right: all neurons, M1, M2, neurons with anticipatory activity, and neurons without anticipatory activity. Changes in Fano factor are most prominent in neurons with anticipatory activity.

