Fig. 7.

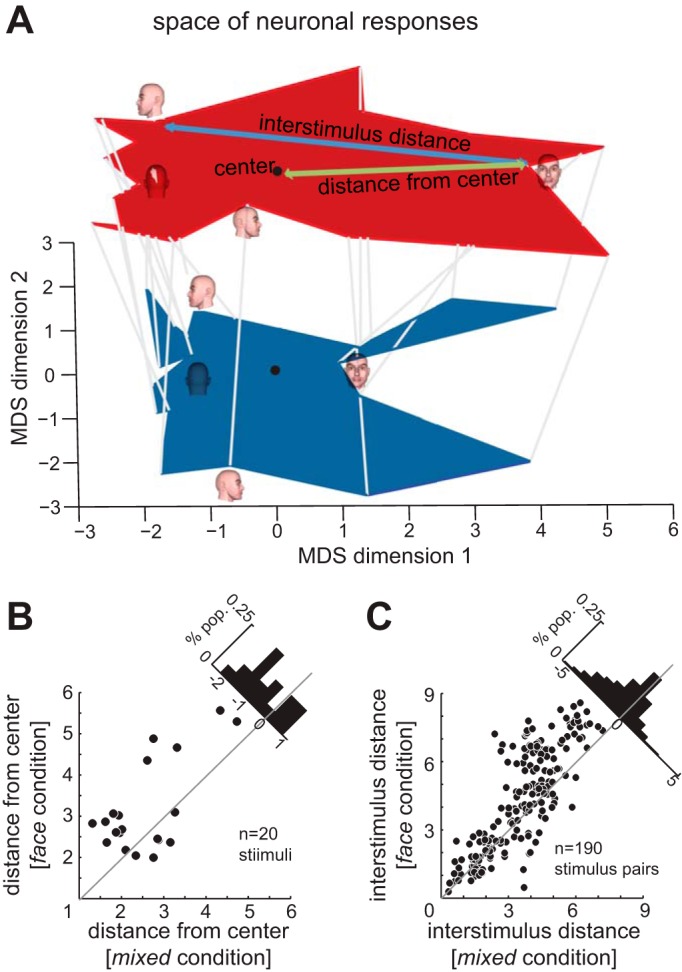
Effects of stimulus context on the neuronal space representing face views. A: the space of neuronal responses to different face views, projected onto the two most significant MDS dimensions, in the mixed condition (blue) and the face condition (red, plotted in the same two dimensions but shifted vertically for visibility). Each gray line connects the location of the stimulus in the space generated based on responses of 131 IT neurons in the mixed condition to the location of the same stimulus in the space produced by responses of the same neurons in the face condition. The four face views show the locations of responses to those images in the neural response space in each condition. The green arrow indicates the distance of one stimulus from the center of the space (quantified for all stimuli in B). The blue arrow indicates the interstimulus distance for one pair of stimuli (quantified for all stimulus pairs in C). B: distance from the center of the neuronal response space for each of the 20 face view stimuli, in the mixed condition (x-axis) vs. the face condition (y-axis). Histogram in top right: change in distance from center of neuronal space between conditions; negative mean value indicates a shift away from the center in the face condition. C: distance in neuronal space between pairs of different face view stimuli, in the mixed condition (x-axis) vs. the face condition (y-axis). Histogram in top right: change in interstimulus distance between conditions; negative mean value indicates a greater interstimulus distance in the face condition.
