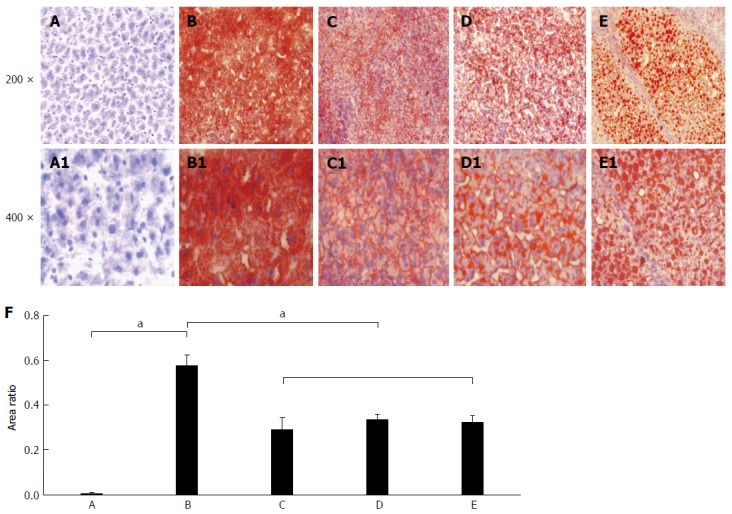
Figure 2.

Rat hepatic lipid accumulation in the different groups after liver section staining with the Oil Red O. The status of hepatic lipid accumulation in the different rat groups was analyzed after liver section staining with the Oil Red O method. A: Liver sections of control rats with normal diet; B: Liver sections of the fatty liver rats with high-fat diet without 2-fluorenylacetamide (2-FAA); C: Liver sections of the degeneration rats with high-fat diet containing 2-FAA, at early stage; D: Liver sections of precancerous rats with high-fat diet containing 2-FAA, at interim stage; E: Liver sections of cancerous rats with high-fat diet containing 2-FAA, at later stage; F: Relative quantitative analysis of fats in the liver tissue; A-E: The original magnification was × 200; A1-E1: The original magnification was × 400. aP < 0.05.
