FIG 1.

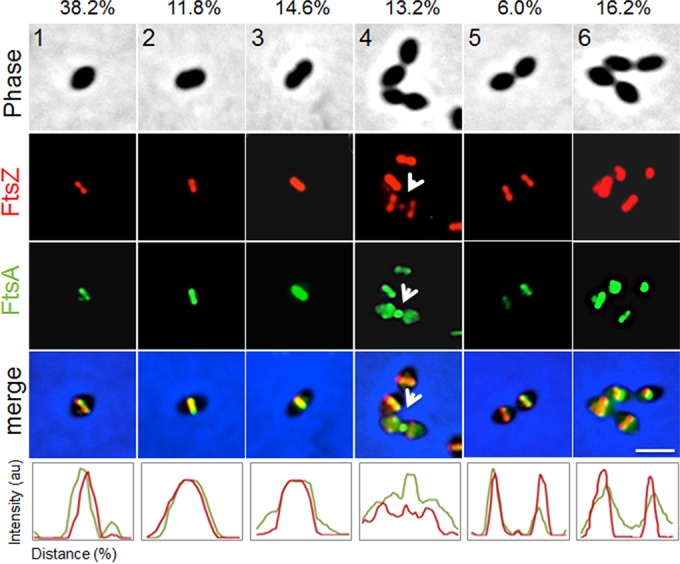
FtsA colocalizes with FtsZ throughout the cell division cycle. For representative stages of the cell division cycle 1 to 6 (top row), Rx1 cells producing FtsZ-mCherry and GFP-FtsA were imaged by phase-contrast and fluorescence microscopy. Arrows highlight FtsZ and FtsA at a deeply constricting septum upon relocalization of some FtsZ and FtsA for the next round of division. Percentages of cells at the indicated stage are listed above the representative images. Fluorescence intensity plots for each stage are shown at the bottom. au, arbitrary units. Scale bar, 1 μm.
