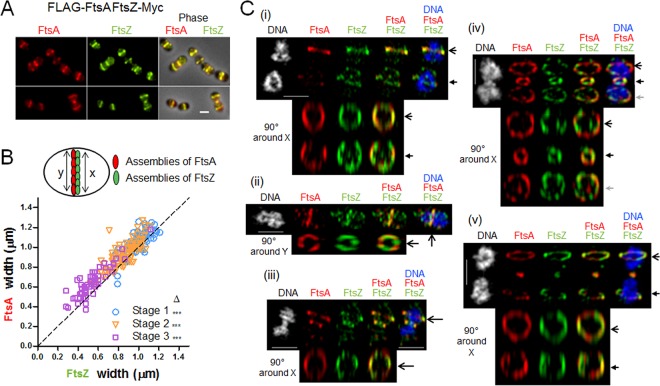
FIG 2.
Two-dimensional- and 3D-SIM IFM of FtsA and FtsZ in strain D39 Δcps reveals colocalization of FtsA in a ring wider than the FtsZ ring. Strain IU10304 (D39 Δcps FLAG-ftsA ftsZ-Myc) was grown to mid-exponential phase in BHI broth and processed for dual-protein 2D- and 3D-SIM IFM with DAPI labeling of DNA, as described in Materials and Methods. (A) Representative fields of 2D-IFM images showing FtsA and FtsZ colocalization during the cell cycle. (B) Top, schematic diagram showing the FtsZ ring versus FtsA ring measurements. Bottom, scatter plot of the paired widths from the same cells of FtsZ and FtsA fluorescently immunolabeled regions at midcell equators and septa of cells at division stages 1 to 3. Width measurements and plotting were done using the IMA-GUI program (see Materials and Methods). The dotted reference line intercepts the origin with a slope of 1. Differences between the paired widths were calculated for each cell in each divisional stage, and the null hypothesis that the mean difference was 0 was tested by 1-sample Student's t test, where *** represents a P value of <0.001 (44). Septal widths of stage 4 cells were not analyzed, because FtsZ and/or FtsA may have been already absent from midcell and not completely assembled yet at future division sites. (C) Representative 3D-SIM IFM and DAPI images obtained of strain IU10304 at different division stages. Each image (i to v) is a different cell in which one or more divisome rings are rotated along the axis indicated on the left of the panel. DNA (DAPI-stained image) is pseudocolored white or blue in column 1 or 5, respectively. FtsA and FtsZ are pseudocolored red and green, respectively. The first row of each image represents images captured in the xy plane, while second-row images were obtained by rotating a section of the cell around the x or y axis. Individual rotated daughter and/or septal rings are indicated by the corresponding arrows of the nonrotated cells. (i) Postdivisional pneumococci (two stage 1 cells) showing that both daughter cells contain FtsZ and FtsA ring colocalization at future division sites. (ii) Predivisional cell showing FtsZ and FtsA ring septal colocalization. (iii) Early divisional cell showing FtsZ and FtsA rings at the equator of one of the two future dividing daughter cells. (iv) Middivision cell showing constricting FtsZ and FtsA rings at actively dividing septa and newly formed FtsZ and FtsA rings at equators of future dividing daughter cells. (v) Late-division pneumococci in which FtsA and FtsZ rings are located at equators of future dividing daughter cells and only a dot of both FtsA and FtsZ is present at the former active division septum. Images are representative of >50 3D-reconstructed cells in different division stages from two independent experiments. Scale bars in panels A and C, 1 µm.

