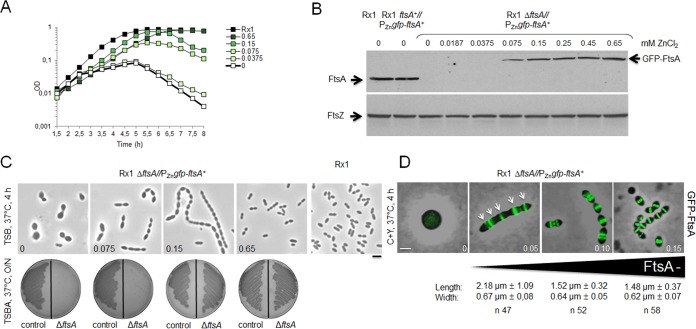
FIG 3.
Depletion of FtsA inhibits septation and results in cell ballooning and lysis. (A) Growth curves of cells depleted of FtsA in TSB at 37°C using different levels of ZnCl2 induction to express GFP-FtsA in the Rx1 ΔftsA//PZngfp-ftsA+ strain. (B) Immunoblots showing native FtsA or GFP-FtsA in uninduced samples (0 mM ZnCl2) of Rx1 and its merodiploid derivative Rx1 ftsA+//PZngfp-ftsA+ and in uninduced (0 mM ZnCl2) or induced samples of Rx1 ΔftsA//PZngfp-ftsA+ (upper image). An anti-FtsZ immunoblot for the same samples was used as a loading control (lower image). (C) Phase-contrast micrographs of representative fields of Rx1 ftsA+//PZngfp-ftsA+ or Rx1 ΔftsA//PZngfp-ftsA+ cells grown in TSB at 37°C in the absence or in the presence of different ZnCl2 concentrations (0, 0.075, 0.15, and 0.65 mM), taken 4 h from the start of FtsA depletion (upper images); growth on TSBA plates (Rx1 ftsA+//PZngfp-ftsA+ control strain on the left side and Rx1 ΔftsA//PZngfp-ftsA+ on the right side) with the same ZnCl2 concentration is shown in the lower images. O/N, overnight. (D) Combined phase-contrast and fluorescence micrographs of Rx1 ΔftsA//PZngfp-ftsA+ cells grown in C+Y medium at 37°C with or without different ZnCl2 concentrations (0, 0.05, 0.10, and 0.15 mM), taken 5 h from the start of FtsA depletion; GFP-FtsA localization to multiple bands in filamentous cells is highlighted by arrows. Average cell length and width at each stage are shown below the corresponding micrograph. Scale bars, 1 μm.

