FIG 6.
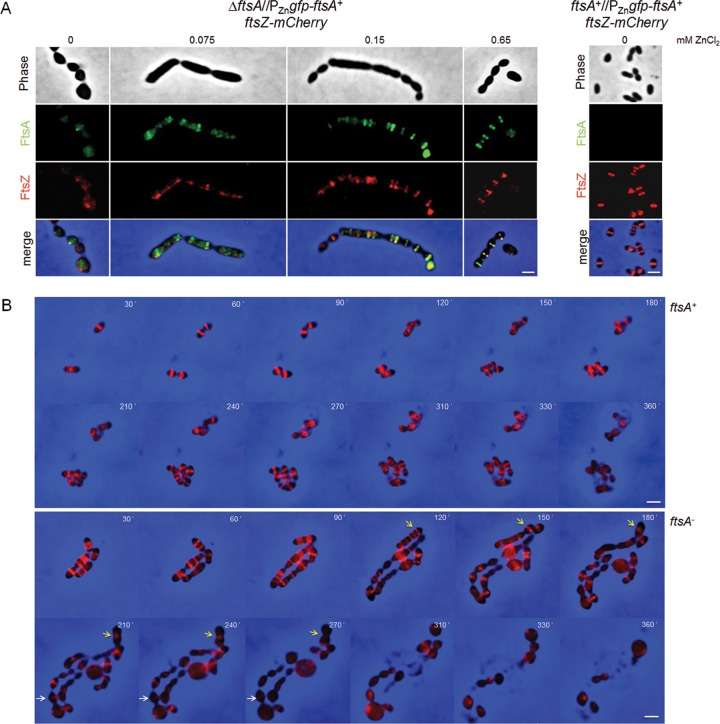
Depletion of FtsA results in delocalization of FtsZ. (A) Rx1 ΔftsA//PZngfp-ftsA+ and Rx1 ftsA+//PZngfp-ftsA+ cells expressing ftsZ-mCherry were subjected to different concentrations of ZnCl2 for 5 h in TSB at 28°C and imaged by fluorescence and phase-contrast microscopy, as described in Materials and Methods. Scale bars, 1 μm. (B) Individual time course of growing Rx1 ftsA+//PZngfp-ftsA+ cells expressing ftsZ-mCherry (upper images) and Rx1 ΔftsA//PZngfp-ftsA+ cells expressing ftsZ-mCherry (lower images), showing how FtsA depletion leads to perturbation of FtsZ-mCherry rings and cell elongation, followed by cell expansion and lysis. The number in the upper right corner of each frame indicates minutes after ZnCl2 removal. Two prominent FtsZ-mCherry rings that eventually delocalize upon ftsA depletion are highlighted by white and yellow arrows. Scale bars, 1 μm.

