
Fig. 4.
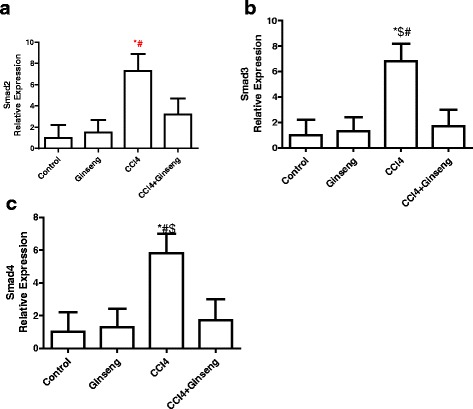
Effect of CCl4, ginseng, and CCl4 + ginseng on the expression of Smad2 (A), Smad3 (B) and Smad4 (C) in the liver. Data are the mean ± SEM (n = 10). *, # and $ indicate a significant change from the control, ginseng, and CCl4 + ginseng, groups, respectively (p <0.05 using ANOVA followed by Tukey—Kramer as a post ANOVA test)