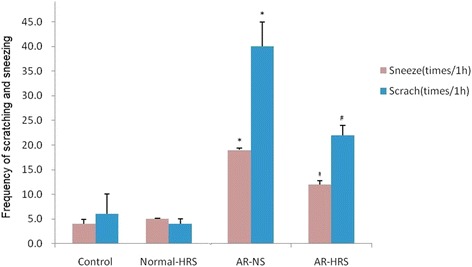
Fig. 1.

Frequency of scratching and sneezing of guinea pigs. For the four groups: saline control, normal-HRS, AR- NS and AR-HRS. Each column and vertical bar represents the mean ± S.D. *,**: Significantly different from the control group (p < 0.05 and p < 0.01, respectively). #,## Significantly different from the AR-NS group (p < 0.05 and p < 0.01, respectively)
