
Fig. 2.
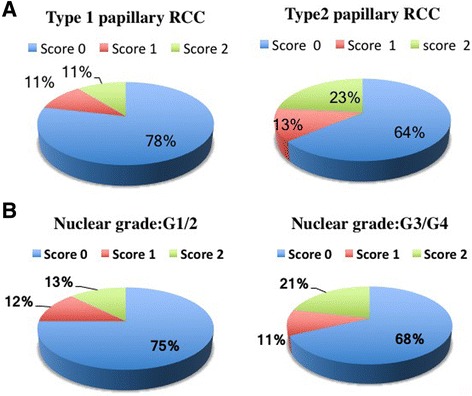
The frequencies of scores 0, 1, and 2 in pRCC. Cases were divided into two groups by histological subtype (a) or nuclear grade (b), and the frequencies of scores 0, 1, and 2 are shown
Official websites use .gov
A
.gov website belongs to an official
government organization in the United States.
Secure .gov websites use HTTPS
A lock (
) or https:// means you've safely
connected to the .gov website. Share sensitive
information only on official, secure websites.
The frequencies of scores 0, 1, and 2 in pRCC. Cases were divided into two groups by histological subtype (a) or nuclear grade (b), and the frequencies of scores 0, 1, and 2 are shown