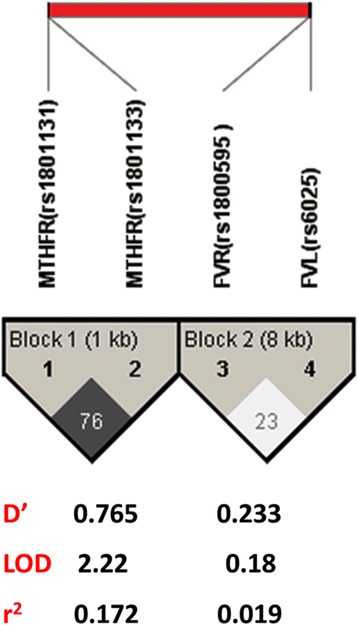
Fig. 2.

Estimated linkage disequilibrium and location of haplotype blocks. LD plots with 1 Kb and 8 Kb between marks are contained within black triangles in the figure, and markers order are outside these triangles. Evidence for LD is shown as different shades (white for low D’ and dark gray for high D’). The haploblocks were identified using a confidence interval algorithm in haploview program version 4.1
