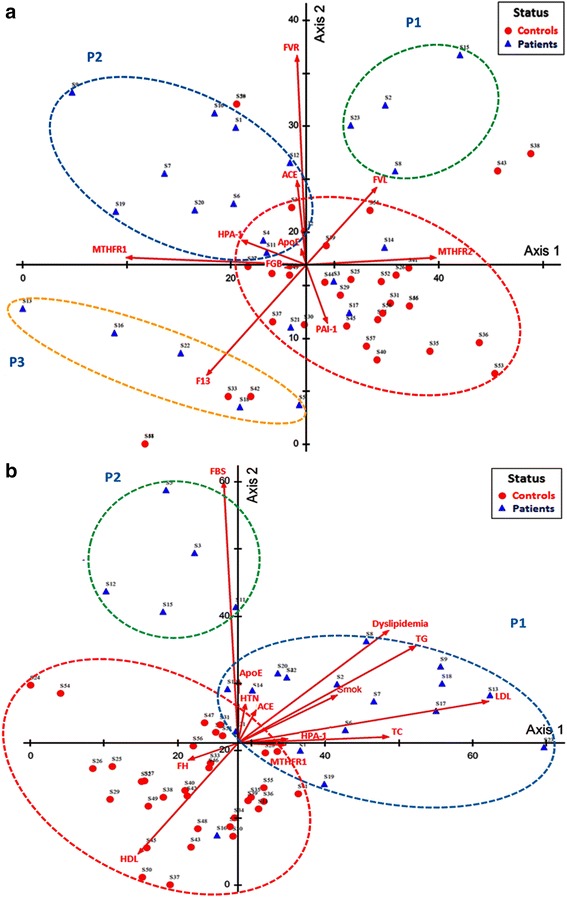
Fig. 3.

Detrended correspondence analysis ordination plots showing the distribution of patient and control samples. DCA was done to show the relations among subject groups and genes (a) along with other environmental risk factors (b). DCA was done after rescaling axes. Red circle surrounds a control group while other colored circles for patient groups. Results were plotted on Axes 1 and 2
