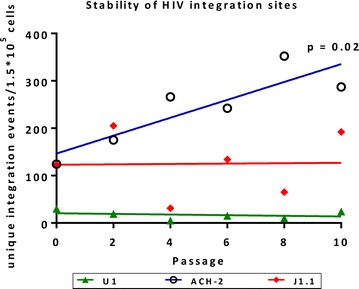
Fig. 1.

Change in frequency of HIV integration sites following passaging of cell lines infected with replication-competent HIV. The frequency of unique integration sites per 150,000 cells is shown following passaging of the U1 (green), ACH2 (blue) and J1.1 (red) cell lines. Linear regression was used to determine if the change was statistically significant
