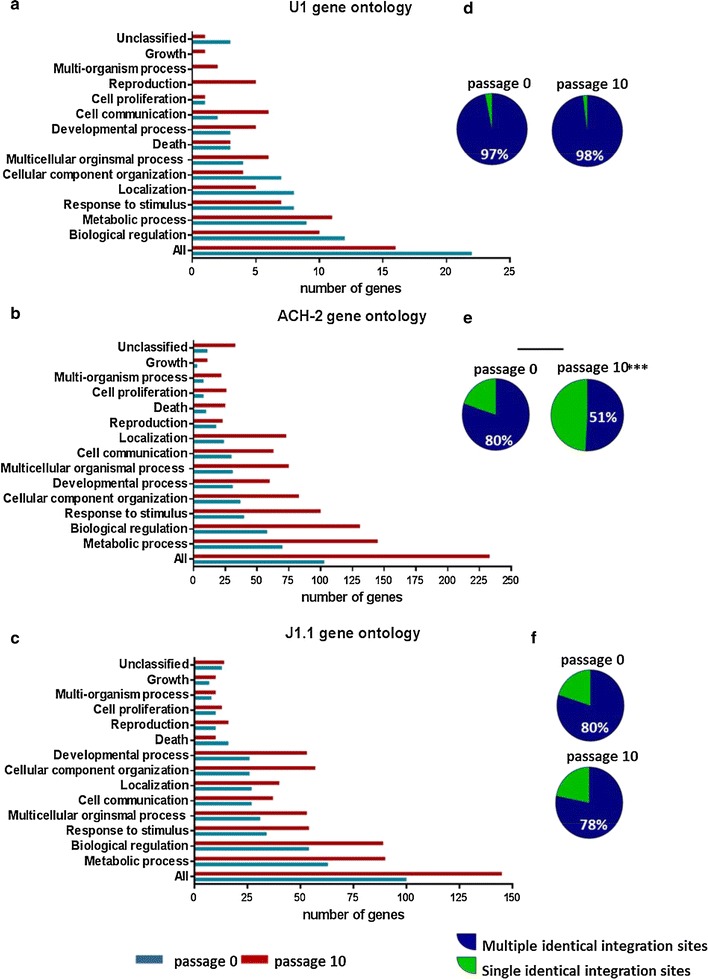
Fig. 3.

Gene ontology analysis of latently infected cell lines. The gene ontology of HIV integration sites detected in the a U1, b ACH-2 and c J1.1 cell lines using Gene SeT Analysis Toolkit is shown as the number of genes in a distinct family for passage 0 (blue bar) and passage 10 (red bar). The proportion of HIV integration sites detected more than once (blue, multiple integration events) or on one occasion (green, single integration event) in the d U1, e ACH-2 (3e) and f J1.1 cell lines at passage 0 (p0) and 10 (p10) is shown as a pie chart
