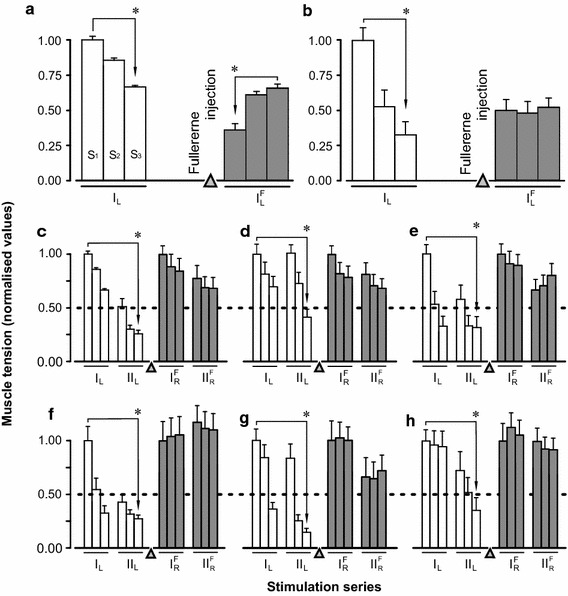
Fig. 4.

Averaged characteristics (mean ± SD) of normalised (to average values S1) values of the muscle strength during different parts of the fatigue stimulation (S1, S2, and S3; Fig. 2) before and after (white and grey bars, respectively) C60FAS administration into the left m. triceps surae (TS): a, b the results of two fatigue tests before and after C60FAS administration into the left TS; c–h the results of six fatigue tests of the left TS (open bars) before C60FAS administration, and right TS (grey bars) at 52 min after C60FAS administration into the left TS. Asterisks significant differences (p < 0.001) between the muscle strength during time intervals S1 and S3 in one or more series of the stimulation. I, II successive series of fatigue stimulations (normalisation performed by S1 in series I). Indices: L, R left and right TS; F registration of muscle force after the administration of C60FAS into the left TS. Triangle marks the moment of C60FAS injection
