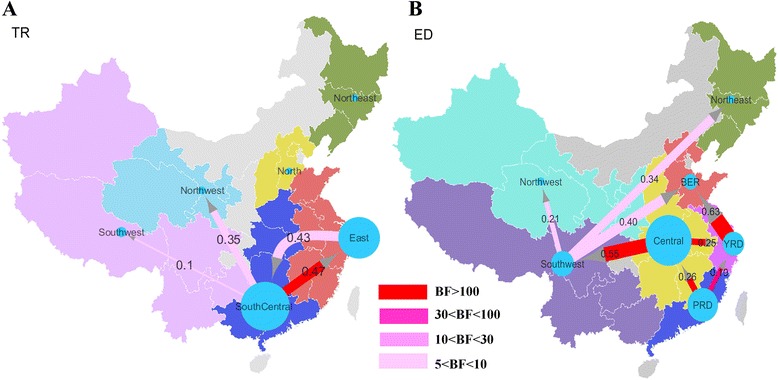
Fig. 2.

Diffusion networks with quantified diffusion rate and BF support. Quantified diffusion rate between regions and BF support were estimated by an irreversible discrete trait model on the phylogeny of PB2 segment. Areas for each region type are labelled by the same colour in the region annotated phylogenetic trees in Fig. 1. The size of the blue circles represent the AIV sample size in each area. The diffusion rate and statistical support for all six internal segments are summarized in Additional file 1: Table S6 and Table S7. The map source is National Science & Technology Infrastructure of China, National Earth System Science Data Sharing Infrastructure (http://www.geodata.cn). Traditional regions (a) and economic divided zones (b) were mapped in ARCGIS (http://www.esri.com/software/arcgis). The diffusion networks on the maps were made via Cytoscape v3.1.0 (http://www.cytoscape.org/). a Diffusion network of AIV among traditional regions. b Diffusion network of AIV among economic divided zones
