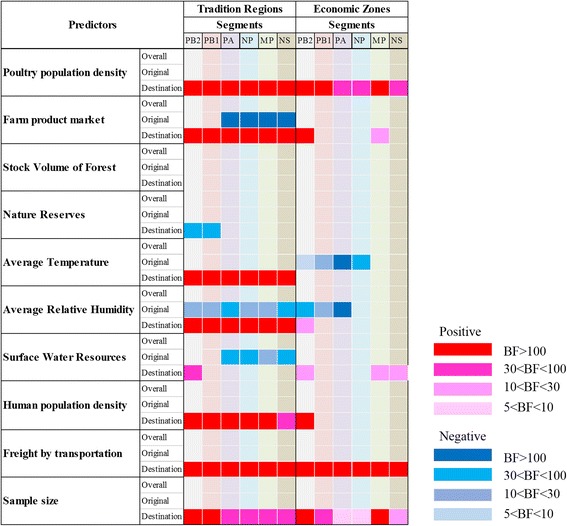
Fig. 4.

Predictors of the Chinese AIV spatial diffusion on 6 internal genes segments. For the 10 predictors, their correlations to the AIV diffusion in two region types (traditional regions and economic divided zones) are summarized in the cells, with rows representing predictors and columns representing six internal segments (PB2, PB1, PA, NP, M, NS) of the Chinese AIV dataset. The markers of the correlation with statistical supports are on the right. Red indicates positive correlation, blue indicates negative correlation. The rank of colours indicating the Bayes factor (BF) support from low to high; blank cells indicate that either no correlation or no BF support was detected. The inclusion probabilities and the log coefficients for each predictor for each region type in all six internal segments are in Additional file 1: Table S8
