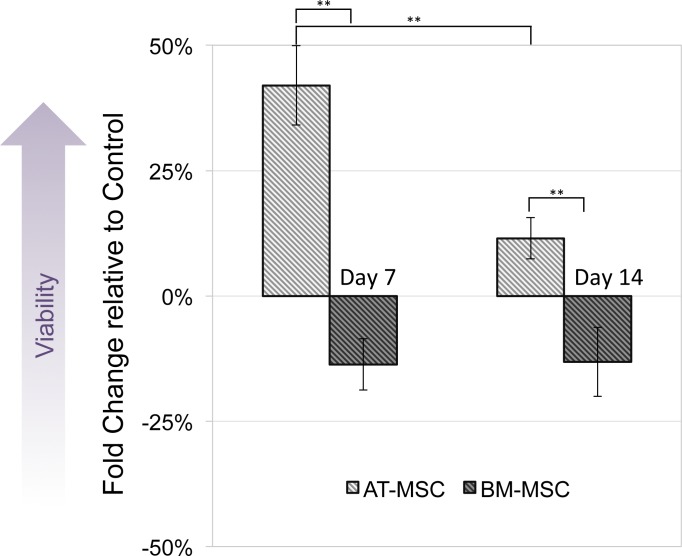
Figure 3. Cell viability.
Measured by MTT assay, compared between electrically stimulated and non-stimulated controls. No significant difference in cell viability was detected between ES and non-stimulated control AT- and BM-derived MSC at 7 and 14 days (Values are shown as means ± standard deviations (n = 3) ** p < 0.01).

