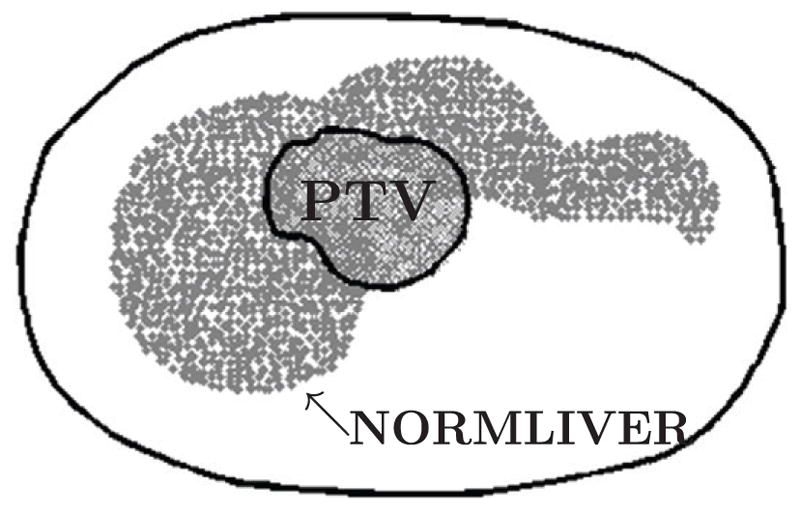
Figure 2.

Geometry of 2D liver case (axial view). The small contour represents the boundary of the PTV voxels and is surrounded by normal liver voxels. The large contour represents the boundary of the patient and contains normal tissue voxels that are not shown.
