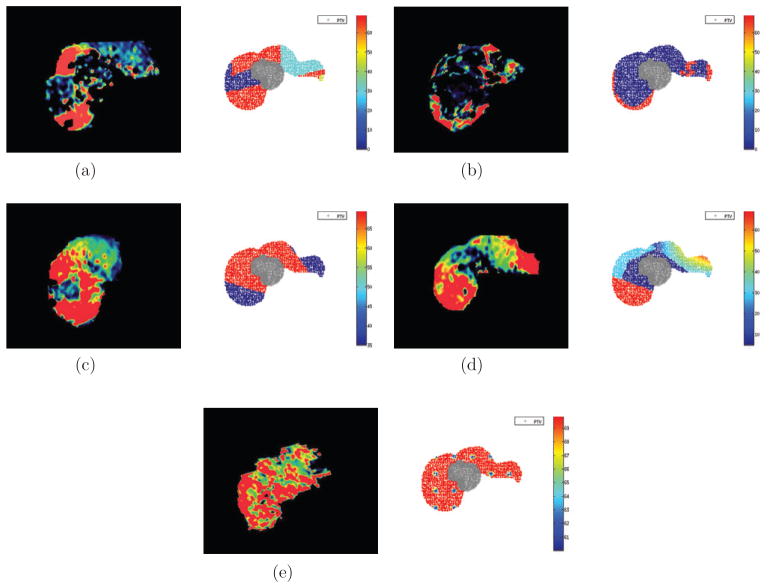
Figure 3.
Commonly encountered perfusion patterns on DCE-MRI (left); synthesized 2D liver cases with PTV in gray and surrounding liver voxels color-coded by relative importance (i.e. gj(fj)) values (right). (a) Pattern P1: large clusters of high and poor perfusion. (b) Pattern P2: small regions of high perfusion. (c) Pattern P3: high perfusion around tumor. (d) Pattern P4: poor perfusion around tumor and high elsewhere. (e) Pattern P5: high perfusion throughout.

